Mamocoin
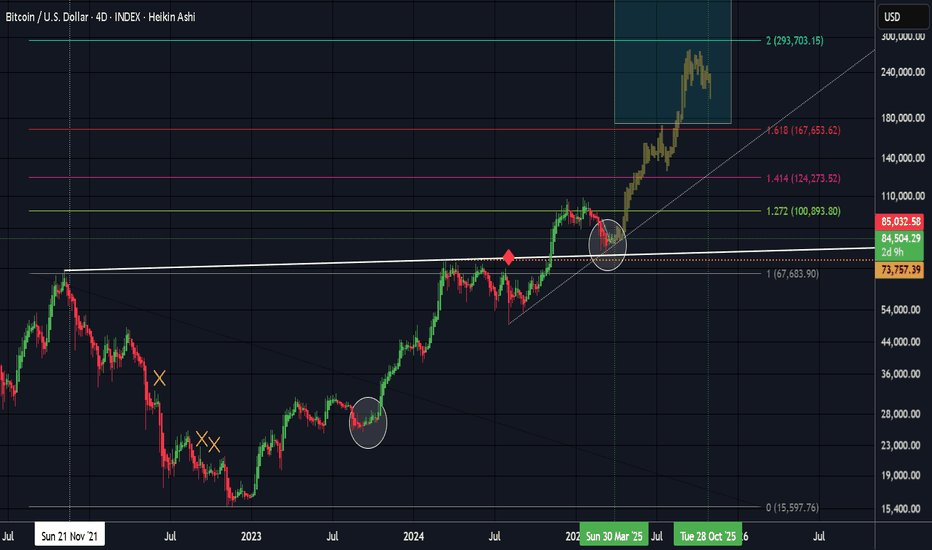
PremiumBitcoins projected path based on Fib expansion levels and previous price action (come back to this one)
Bitcoin and the S&P500 are still showing correlation. S&P500 Futures (ES1! ticker) has a gap about 3% lower. I think we need to fill this gap (resulting in a bounce) for BTC to start moving with greater strength to the upside. The gap is also in the range of the 0.5 Fib retracement (50% of that range). This could see BTC come back to the lower 80k's region...
The massive move initiated from Trumps tweet Sunday about the Crypto Strategic Reserve has left a massive gap on the Bitcoin Futures Chart. Gaps tend to get fill sooner rather than later, with a high 90% hit rate on gaps getting filled. We could see a pullback this week to fill the gap with another run up following back above 90k to save the weekly close ......
Confluence of fibs at 78k - 80k, trendline support and CME gap
Bitcoin 4D RSI (38) marks all the major bottoms this bullrun
Bitcoins next price target, before some more meaningful resistance, is likely to be in the range of 35.7k - 36.8k. Their is confluence of fib levels in this range. The 0.382 fib level measured from the all time high to the bear market low, and the golden pocket level (0.618 - 0.65 fib level) measured from the next macro high during the bear market to the bear...
Possible head and shoulders forming. Broke the falling wedge and retested for support at the golden pocket retrace. Nice bounce so far. Measured move to new all time highs.
Possible head and shoulders forming. Broke the falling wedge and retested for support at the golden pocket retrace. Nice bounce so far. Measured move to new all time highs.
Comparing Bitcoins mid cycle pullback in 2013 to Matics recent pullback (possibly mid cycle). - We see similar highs and lows on a relative time scale ratio between the two - We see a similar pullback of around 75% for both
Golden Bull Cycle originally posted by Trading Shot on Trading View. The basic theory is that Bitcoin spends approximately equal amounts of time going from the bear market low to the halfing compared to the halfing to the bull market peak. I've added Fib extensions based on the previous bull cycle peak and bear market low. We see on all cycles a struggle at...
2013 v 2021 cycle (2 week chart). Connecting the mid cycle tops on the RSI with a parallel channel shows our current RSI position at the same low as the 2013 mid cycle pullback. Stochastic RSI is also at a similar level.
just now Using the logarithmic extension on the logarithmic chart, and charting the previous bull cycles we see that bitcoin , in the past, has gone to the 2.272 - 2.414 extension using the previous peak and the bottom of the relevant bear market. If history repeats this would put Bitcoin at 207k - 269k.
A 100% Accurate Bitcoin Pi Cycle Top Indicator. Here's my video talking about it. www.youtube.com
Inverted head and shoulders possibly forming on Bitcoin with a measured move to 61500 once breaking the neckline
CME futures chart for bitcoin, testing resistance and the 0.382 level on the fib retracement. Pullback or breakout coming?
Everyone is expecting a 39 -40k bounce, but i think we may go to the 21 week EMA at 32 - 33k which will wipe out a lot of over leveraged longs from 40k. Previous bull market had several pullbacks to this moving average. VPVR also supports a bigger drop. RSI also likes to pull back to 55 on the weekly as in the previous bull market.
Bitcoin looking to come down eventually to the 21 weekly exponential moving average which will be lining up with the golden pocket retracement over the next several weeks. This area also has the biggest volume spike on the volume profile indicator. The RSI indicator shows bearish divergence and will come down to a 53 reading shown by the yellow horizontal line...


