Manal120
EssentialPrice breaking the resistant area with a Momentum Candle. overall it's an uptrend. daily and weekly price is over EMA200.
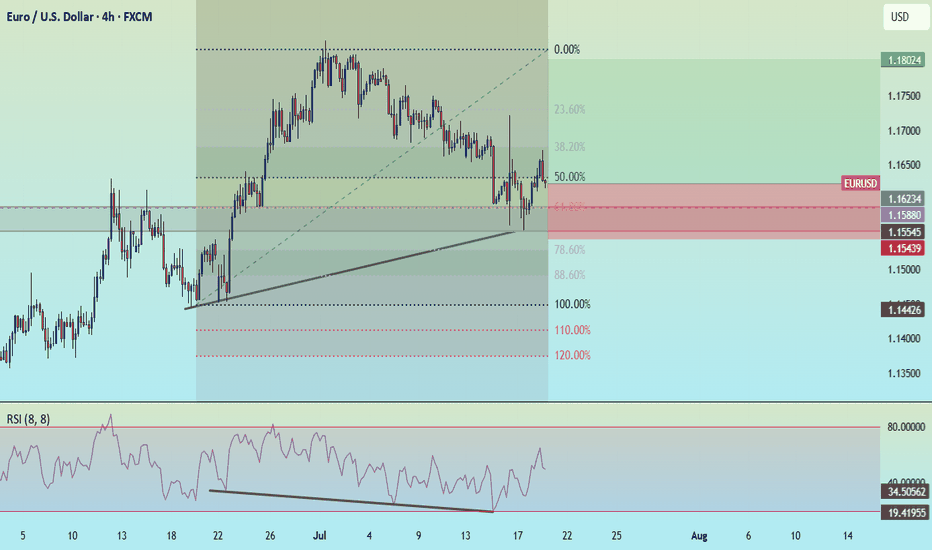
Over all it's an uptrend, I believe price finish the correction by reach 61.8 Fib and price is showering Divergency in the daily Time farm, I expect price to continue with the uptrend.
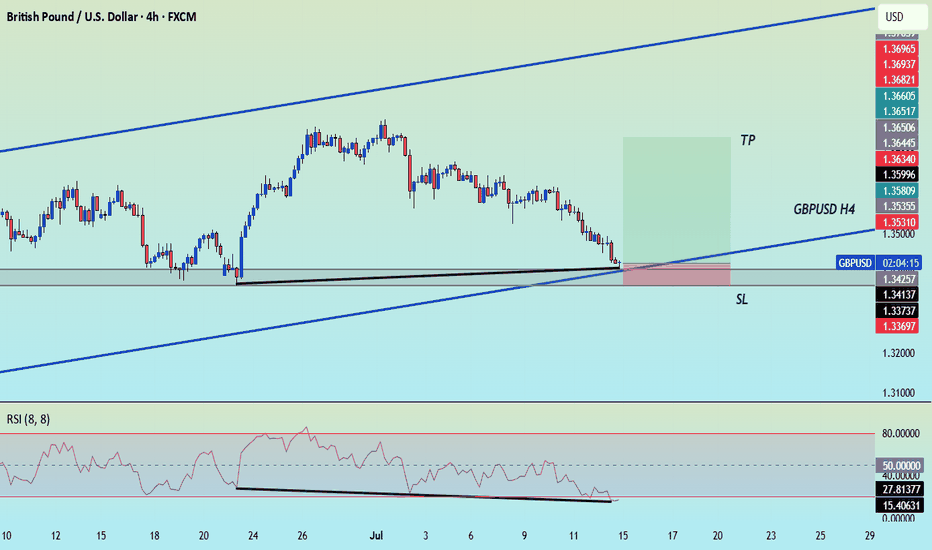
Price is moving in a channel and weekly show uptrend. Price reach strong area of Support, and FIBO show 78.60 Price show Divergency in Daily frame. All this can indicate that price is finish the correction and now ready to join the main uptrend.
Uptrend in the weekly , break resistant with strong momentum Candle. Divergency is showing and It test the Support and now ready to go up with the main trend.
It's a Down trend in the Weekly price under 200 EMA, Pin Par in the weekly time fram. strong Resistant to break to the upside.
NZDJPY finish the downtrend correction and ready to go long. price is above EMA 200 . in H4 is the uptrend started and price above strong Support/Resistant area.
Price above 200EMA weekly and Daily. in 4H price above 50EMA and couldn't break it's support and now it's ready to follow the big trend
Daily prices above 200EMA make it an uptrend, 4h correction downtrend is finished based on Fibo golden No 61.8 in a support area.
Price above 200EMA weekly and Daily. in 4H price above 50EMA and couldn't break it's support and now it's ready to follow the big trend.
Downtrend weekly and Daily, under 200 EMA. 4-hour correction trend that comes to its end and is ready to join the significant movement of the weekly frame. You can sell from the Resistant area or wait to break the trendline and EMA 50 .
Daily time frame shows Supply and Demand, price moving between two zones area. price above the trend line in H4.
Down Trend from Daily and sell based on weekly Stochastic indicator.
Monthly and Weekly downtrend, you are selling Pullback. Price under 200EMA Daily.
Daily Resistance and under EMA50, Sell in Daily and enter from 1H.
Sell Daily enter from H1. Daily Resistance and under 50EMA
Cross 50EMA and under trendline as well as Daily reach 50 Fibo. SL : 1.22133
Coming from Monthly and Weekly Resistance. Price under Moving Average 20 in the Daily chart.


