MangoMan4
📍 Timeframe: 1D (Binance Exchange) 📈 Current Price: 0.0001268 (+1.93%) Key Technical Insights: Accumulation & Breakout Setup: Price has been consolidating at a low volatility range for several weeks. Potential breakout setup is forming, as indicated by the bullish structure. Support & Resistance Levels: Support: 0.0000950 (Stop-loss region) Current Resistance:...
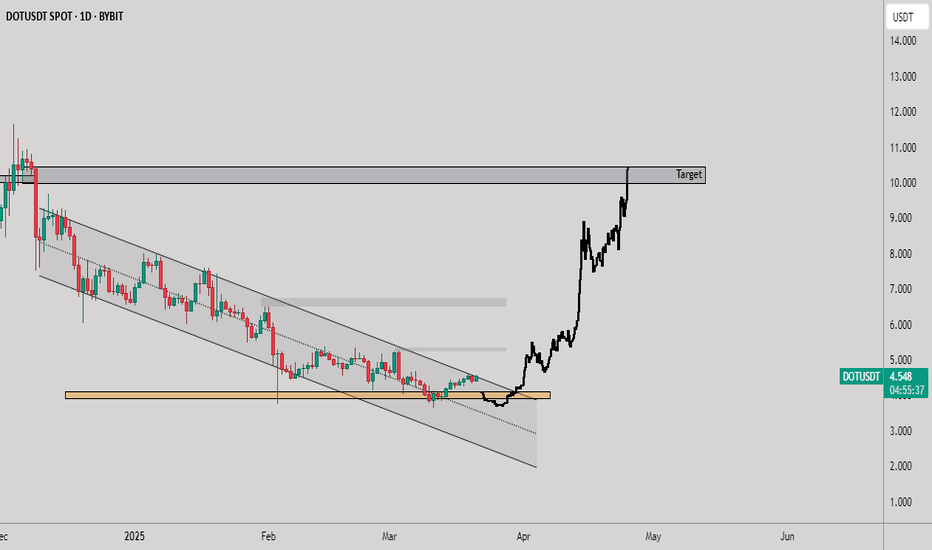
📍 Timeframe: 1D (Bybit Exchange) 📈 Current Price: $4.550 (+3.43%) Key Technical Insights: Descending Channel Breakout: DOT had been trading in a descending channel since late 2024. A successful breakout from the channel indicates a trend reversal. Strong Support Retest & Bounce: The price found support at the $4.00 region (marked in yellow). Multiple tests of...
📍 Timeframe: 4H (MEXC Exchange) 📈 Current Price: $133.02 (+0.57%) Key Technical Insights: Trending Resistance Breakout Zone: The price is approaching a key downtrend resistance (red trendline). A break and close above this resistance could push SOL towards $148–$150 (gray supply zone). Two Possible Scenarios: Bullish Breakout: A breakout above the resistance...
#BTCUSDT Bitcoin is currently displaying bearish momentum following a parabolic rounding top pattern, leading to a decisive break below the $81,000 support zone. 🔍 Technical Analysis: 📉 Breakdown from Support: BTC failed to hold its key support and is now facing a lower high rejection, confirming further downside. 📈 Potential Retest: Expecting a retest of the...
🛠 Technical Overview 🔸 Asset: Solana (SOL) / USDT Perpetual Futures 🔸 Exchange: MEXC 🔸 Timeframe: 4-Hour Chart 🔸 Pattern: Descending Channel 📊 Analysis & Market Observations Solana (SOL) is currently trading within a clear descending channel, facing strong resistance near $135 - $140 (Mini ChoCH) and $150 - $160 (Major ChoCH). 🚀 Bullish Outlook If SOL breaks...
🛠 Technical Overview 🔸 Asset: Bitcoin (BTC/USDT Perpetual Futures) 🔸 Exchange: Binance 🔸 Timeframe: 30-Minute Chart 🔸 Key Structure: Parabolic Curve Breakdown 📉 Bearish Breakdown & Potential Support Bitcoin has broken below a curved trendline, indicating that the bullish momentum is cooling off. The current price action suggests a pullback to a major liquidity...
Overview: Ethereum is currently testing a significant price zone after breaking out of a long-term symmetrical triangle pattern on the monthly chart. The recent drop has brought ETH to a major support area, which could act as a strong demand zone before a potential reversal. Key Observations: Symmetrical Triangle Breakdown: ETH/USDT formed a symmetrical triangle...
Gold (XAUUSD) has shown clear signs of weakness after multiple failed attempts to break above resistance. The descending trendline acted as a strong dynamic resistance, leading to a sharp sell-off. The projected path suggests further downside movement, with increasing bearish momentum. 📊 Technical Breakdown: ✅ Rejection at Resistance: Price failed to break above...
BTC has reacted exactly as expected from the Reversal Area, bouncing back with significant strength. The price action suggests a potential move toward the $85K-$86K resistance zone, where we will look for a breakout or rejection confirmation. 📊 Technical Analysis: Support Held: BTC respected the Reversal Area, leading to a bullish response. Potential Trendline...
🔻 BTCUSDT Breakdown – Where Is the Next Bounce? 🔻 Bitcoin has broken below a crucial support level, confirming a bearish continuation. The price action is following a curved decline, indicating further weakness. 🔹 Key Observations: 📉 Bearish Breakdown: BTC has failed to hold support and is now in a downtrend. 🔎 Short-Term Support Zone: $82,000 – $81,000...
Bitcoin is currently in an indecisive phase, showing signs of both potential upward and downward movement. Traders should exercise caution as the price hovers around critical support and resistance zones. Key Levels to Watch 📌 Support Levels: $86,500 - $86,000 (Short-term support) $82,500 - $81,500 (Major support zone) 📌 Resistance Levels: $89,500 - $90,000...
Bitcoin has been forming clear liquidity levels and moving in a structured manner. After a strong recovery from support, BTC is now approaching a key resistance zone, which previously acted as a rejection point. Technical Breakdown 📍 Support Zone: $87,000 – $88,000 📍 Resistance Zone: $90,000 – $91,000 📍 Current Price: $89,030 🔸 Market Structure: A series of...
BTC has broken below a key trendline support, confirming a bearish bias. The next price targets are the Mini Reversal Area ($86K - $85K) and the Major Reversal Area ( FWB:83K - GETTEX:82K ). 📍 Technical Breakdown: The price is trending downward after a failed support retest. A lower high formation suggests a continuation to lower levels. If the Mini Reversal...
Market Structure & Price Action USD/JPY is currently trading at 149.182, showing a weak bullish reaction but still respecting the broader descending trendline resistance. The pair has been following a well-defined bearish channel, making lower highs and lower lows. Key Observations: 📉 Trendline Rejection: The price has tested the descending trendline and faced...
Bitcoin is currently trading at $88,720 (+0.76%), showing signs of exhaustion after a breakout attempt. The price action suggests a fakeout in the reversal area, which could lead to further downside if support fails. Key Observations: Fakeout in the Reversal Area: BTC briefly broke above resistance but failed to sustain momentum, indicating potential...
🔹 Current Market Structure: The CHF/JPY pair is currently trading within an indecisive area, facing key levels that will determine its next move. The price recently tested a strong resistance zone and is now showing signs of weakness. 🔹 Key Observations: 1️⃣ Indecisive Area – Price is consolidating within a small range. A breakout will provide confirmation of...
🔹 Asset: Solana (SOL/USDT Perpetual Futures) 🔹 Timeframe: 2-Hour 🔹 Exchange: MEXC 📊 Market Overview: Solana has bounced from a key support zone after a strong breakdown, signaling a potential shift in momentum. The structure has confirmed a Break of Structure (BOS), which may lead to further upside movement before facing resistance. 📈 Key Technical Insights: ✅...
🔹 Asset: Bitcoin (BTC/USDT Perpetual Contract) 🔹 Timeframe: 15-Minutes 🔹 Exchange: Binance 📊 Market Overview: Bitcoin has shown a strong bullish impulse after breaking key structure levels, confirming a shift in momentum. However, the price is now approaching a high-probability reversal area, where a reaction is expected. 📈 Key Technical Insights: ✅ Major CHoCH...


