MarcusAtb
Mainly for academic purposes
After yesterday's bull trap out of the old downtrend channel (some would say breakout of the Triangle), the new short term high has created a new pivot point (support) and forces adjustment to the trend line (in this case Channel). With the correction still underway and clearly visible as Triple Three W-X-Y-XX-Z where the last leg Z is underway, we can make a...
Looking at the major moves of Bitcoin Prices which takes place quite regularly thus far in every 7 days in the last 50 days
Identified confluence of Value Area High and Lows from various timeframes and POC/VWAP including Fibonacci Retracements as S/R levels Daily Chart : Group 1 (16th-20th Jan) Low 1152 High 1438 Group 2 (21st-26th Jan) Low 1042 High 1475 65% Fib on short term impulse as Trigger Downturn Confirmation to 1000 or lower 920 15-minute chart : 1300 Head & Shoulder It...
Considering that ETH already reached its all time high previously (recognised from the Ending Diagonal on Wave 5 of the last Parabolic Uptrend which typically turns into a Trend Reversal) and signalled an immediate reversal. Could this be the ensuing EW count? Pls comment
EOSBTC is seeing a very complex extended corrective structure WXYXZ and it is far from over. EOSBTC appears to be Bullish in the Short-term but Bearish in the Medium-term. Starting with the weekly chart, we are still in the correction phase of the impulse we saw in January. We then drew the pitchfork channel to set the boundaries. Then moving to the daily...
The market is acting strange lately....so I suppose this is the least thing it will do :-D
Continuing as usual even though we have seen recently many TAs were smashed due to Fundamental News that disrupt and cause price action moves that are abrupt. I think if the conditions (boundary conditions in mathematical terms) remain the same, this is what it will progress into. This is not an investment advice. We could see a drop either : 50% Fib Retracement...
Here I just did a EW recount on VENBTC. Looks like a major drop to 30k and even as low as 27k. I have used the most probable length of W3 - 1.618xW1. The next likely is 2.618xW1 which would be a very deep drop. (If this happens, we could get to 78.6% retracement for VEN! and standard most likely retracement of 0.382 for W4 and most likely 0.618 xW13 for W5. The...
EOSBTC on 4-hr Chart Here I've only looked at Fibonacci Retracement , Trend-based Fib Extensions, RSI, Stoch RSI and EW in the preliminary stage of the developing 2-wave. There is little to support that it may successfully complete the series of 5 waves. However looking at the weekly chart, how bearish BTC is, and especially how LTC reacted yesterday, it is not...
In this Daily chart we can see clearly that the upward move is not an impulse wave but a textbook example of a Triangle. A Triangle happens in the 4th wave, B-wave, Y wave and in the case of sharp correction, the X-wave as this real-life example illustrates. In my opinion, brace yourselves as we can expect a drop to 40,000 followed by a Consolidation Zone This...
XLMBTC DAILY CHART IN BITTREX Hi, I just took a look at the weekly chart, found the trend is still bearish for XLMBTC, spotted the weekly low about last week and then went into the Daily Chart to look at the details. (1) WAVE 1, WAVE 2 - COMPLETED (2) WAVE 3 -UNDERWAY (3) SUBWAVE WAVE 4 IS IN PROGRESS (4) NEXT WILL BE A IMPULSE WAVE 5 DOWN TO COMPLETE THE WAVE...
Bitcoin Index Price Daily Chart (BTCUSD) This is what I think is likely to happen by end of May/early June 2018. Key resistance/support will be 9,500 Breakout resistance will be 11,600 Any prediction should be accompanied by the contratry scenario (BEARISH PREDICTION). I hope to receive some revelations on that too. Lol If you like my posts, please donate...
TRXBTC on hourly chart. This chart formation appears in all time frames, as well as supported with the necessary ingrredients like increasing volume at the Handle and low volume at the center of the cup. the previous all time high and a new high, the down-trending channel for the cup and the rounding bottom of the cup. However, this formation could also fail,...
Hi I am just putting up what I had learnt about EW and other TA stuffs over the last 3 months for Education Sharing purposes. I would like to put this in the Analysis category but with decreasing total marketcap day by day in this space, it is rare to see any wave completing the fifth perfectly. Someone needs to do an indicator that measures the health of trading...
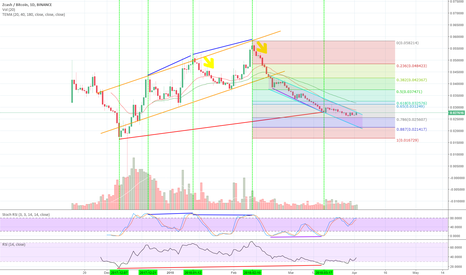
Daily chart shows ZECBTC has been on a narrow downtrend channel for sometime and headed towards the end of its correction. Notice the divergence between today (2nd April and 18th March 2018). Appreciate expert views and comments on this. Thanks
4-hr Chart. Much depends on BTC price action One thing I notice is that as Volume or Total Marketcap decreases, the rare Corrective Structures are becoming more common. In fact so common that the words "Bear Trap" and "Bull Trap" seems to appear everywhere. If we can predict the rare 5 corrective structures, i.e., Triangle, Leading Contracting Diagonal, Ending...


