MasoodAnsari
NZDJPY has broken out of a textbook ascending triangle on the daily time frame, signaling strong bullish momentum. Price is pushing higher with a solid structure and supportive RSI levels, leaving room for continuation. A breakout retest can offer a high-probability entry.
The US100 is showing signs of potential reversal after completing a harmonic ABCD pattern near the wedge resistance. The price has broken below the rising wedge support, indicating bearish momentum. Bearish Confluences: 1) Completed the ABCD pattern 2) Rsisng Wedge Breakdown 3) Clear Bearish RSI Divergence, showing weakening momentum at highs. Targets: TP1:...
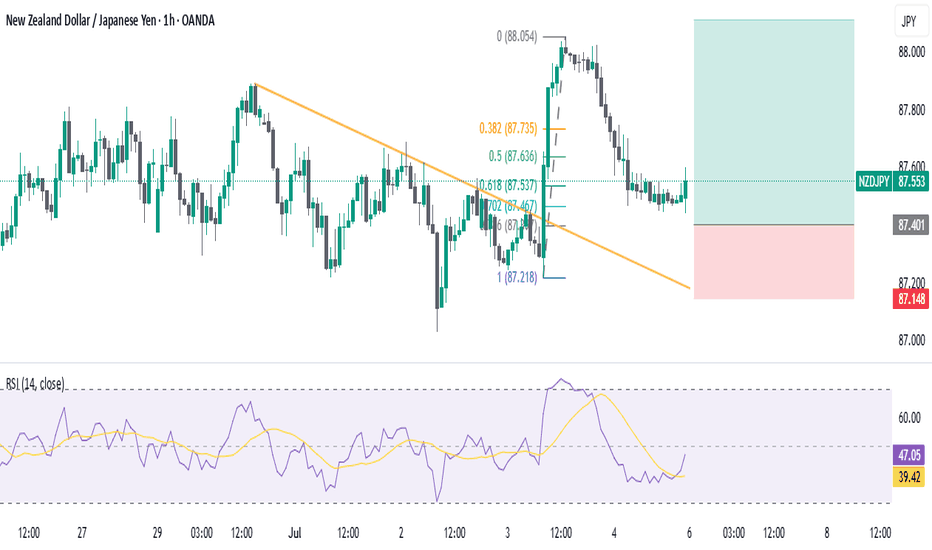
NZDJPY 1H – Price has broken above a descending trendline and is showing bullish momentum. RSI is recovering from near-oversold levels, supporting the bullish bias. This entry aligns with the higher time frame trend, as NZDJPY remains bullish on both the 4H and Daily charts. Trade setup targets the continuation of the overall uptrend with a favorable risk-reward.
ETH forms an ascending triangle near a key resistance zone, indicating potential bullish continuation. A breakout above this range could trigger a rally towards the next major resistance at $3380. The RSI is holding above 65, showing strong bullish momentum. A breakout from the triangle with strong volume may confirm the bullish setup.
NZDJPY has been in a bearish trend on the 1-day timeframe but recently broke and retested a descending trendline, indicating a potential reversal. Consider a buy opportunity at the current price. Set a stop loss below 83.900 to manage risk. Take profit targets are as follows: TP1 at 86.880, TP2 at 88.500, and TP3 at 90.900.
POL 4H chart shows a potential bullish setup, with divergence between price and RSI. Price is retesting the breakout zone around 530. Look for Buy with SL below 490 and take profit at 640. RSI holding above 50 also shows bullish momentum.
Buy BOP if it breaks above the resistance with a bullish candle. Place you Stop loss 9.15.
Buy CNERGY if it breaks above 7.50. Place your Stop Loss below previous HL.
NZDJPY is in bullish trend making HHs and HLs. Look for buy opportunity as it is retesting a key support area. Put Stop loss below previous HL.
Gold consolidates within a symmetrical triangle after a strong bullish rally and a sharp correction. The price is nearing the triangle's apex, suggesting a major breakout or breakdown. The structure shows sellers consistently pushing lower highs, while buyers are holding the same support zone around 3260–3270. This indicates compression, with volatility likely to...
A bullish RSI divergence has formed on the CADJPY daily (1D) chart at a key resistance level, signaling a potential bullish reversal. Wait for a breakout above the descending trendline, followed by a retest of the trendline, to confirm the entry for a long position.
Look to buy USDJPY as it has just retraced back to previous support after forming a bullish divergence at 4H and slightly breaking the previous LH. RR is shown in the chart.
USDCHF is ranging at 1W time frame and is currently touching the weekly support level. Look to buy at the current price for an aggressive entry or wait for a candlestick confirmation for a precise enrty.
GBPCAD has formed a bullish divergence at key support levels at the 4H and 1H time frames. Look to buy if it breaks above the previous LH and retraces back to the resistance-turned support level, as shown in the chart.
EURUSD has formed a bearish divergence at the 1D timeframe after testing a major resistance zone, which may cause a deeper correction. Sell at the current price and place SL above the previous HH. Tip: Look for the buy opportunity when this trade hits its sell target.
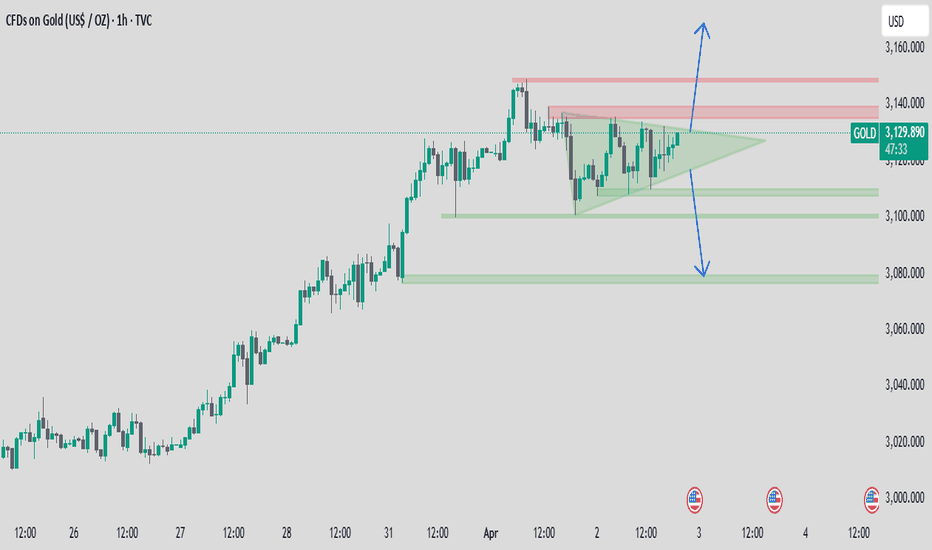
Gold (XAU/USD) is consolidating within a symmetrical triangle on the 1H timeframe, indicating a potential breakout. A bullish breakout could target the 3,140-3,160 zone, while a bearish move might test the 3,100-3,080 support area. Watch for confirmation before entering a trade. #Gold #Trading #XAUUSD
The US100 is testing 19500-19600 support in descending triangle on the 4H chart, with a bearish breakdown targeting 17200 if breached, or a bounce to 20500 if it holds. Look for buy or sell entries accordingly.
GOLD has made a symmetrical triangle on 30M time frame ahead of FOMC. Look for breakout or breakdown to take entries accordingly.


