Moipone_Phakisi
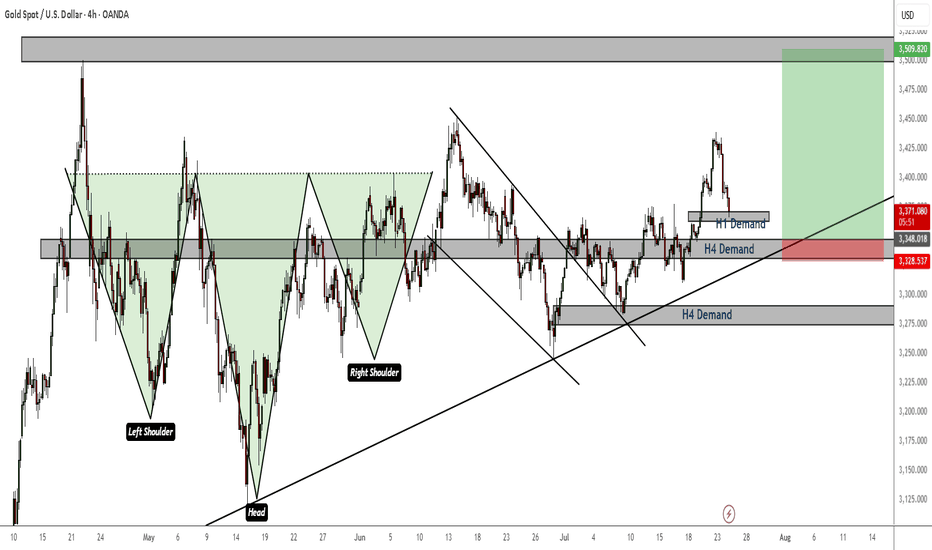
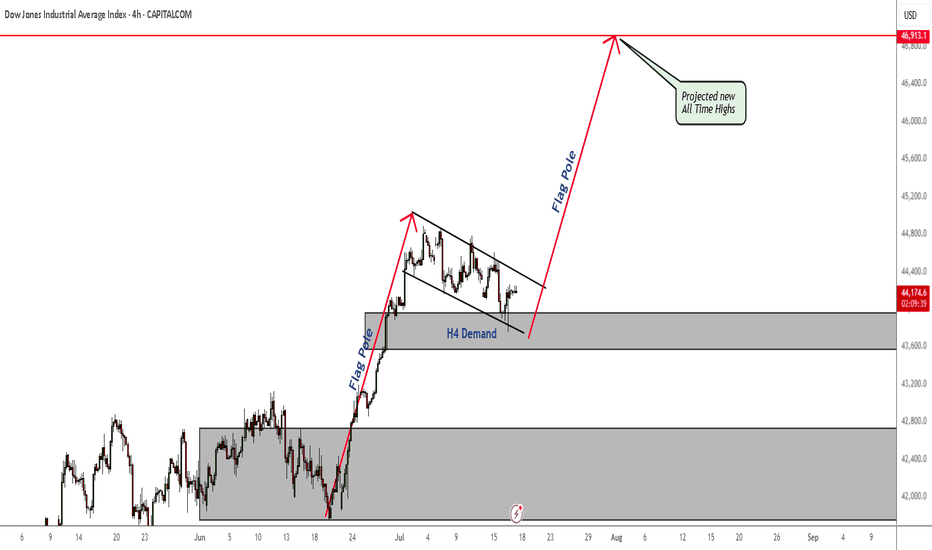
General trend and momentum is still to the upside. We now have a nice pullback and an opportunity to buy low again. Price is currently reacting to an H1 TF demand zone. If this zone breaks, look for entries in H4 demand and continue to ride the bulls to All Time Highs.
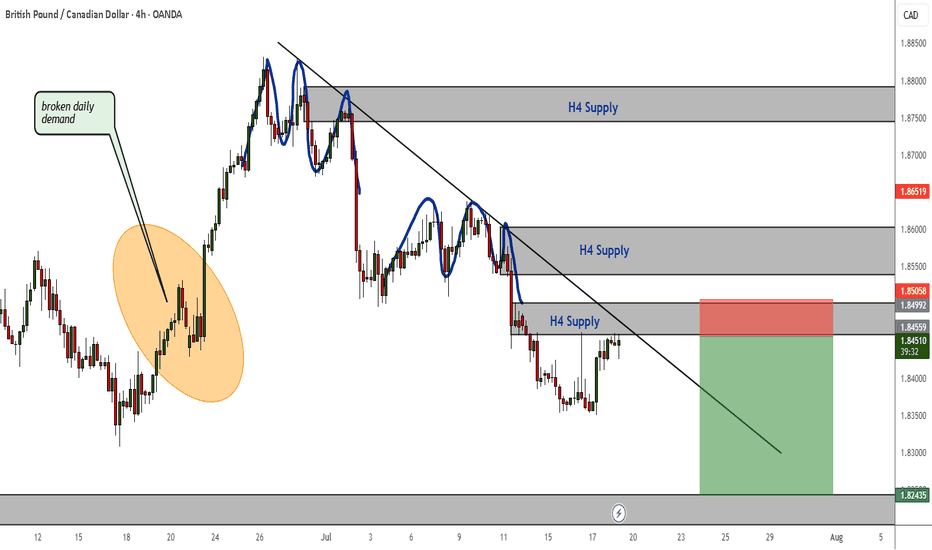
A broken daily demand zone, a resistance trendline showing direction to the downside, bearish continuation patterns (rejection patterns) and consistent H4 supply zones all indicate that this market is bearish and if the current H4 supply holds then use bearish confirmations on LTFs to short to the next support or demand zone.
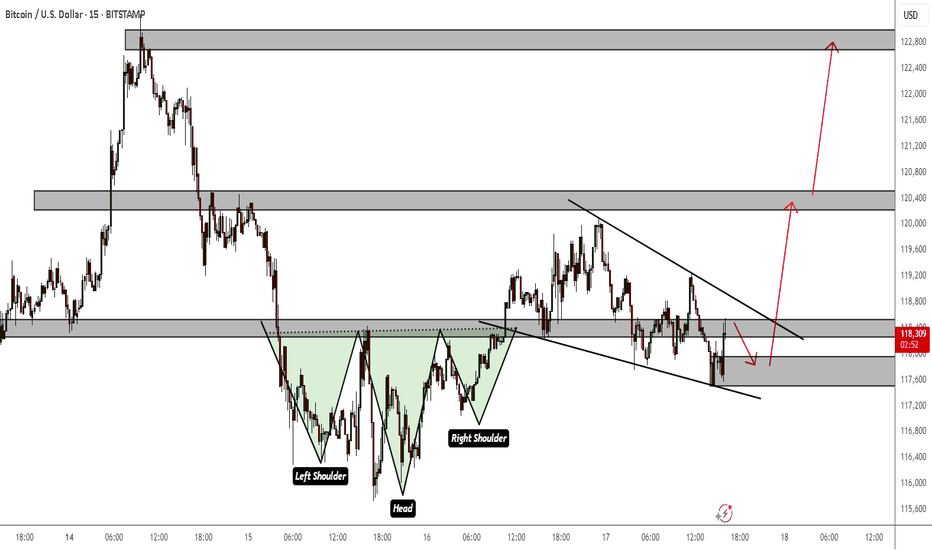
The trend is still bullish and the daily bull flag I posted is still at play. This is just a lower TF perspective within the bigger overacharching view. Inverse head and shoulders and a bullish flag all indicate continuation to the upside. You can use market structure to confirm your entries and your target profit zones if you do not plan on holding until $150k
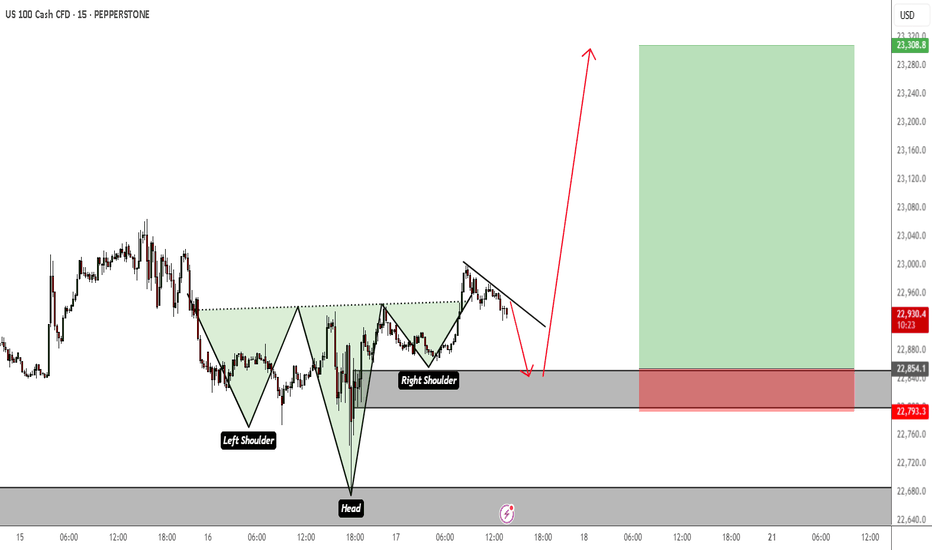
I see a possible retest of an Inverted Head and Shoulders on M15 TF before the bullish momentum resumes. The SL and TP are just a rough estimation. Price could dip a bit lower than that. But my overall bias is bullish.
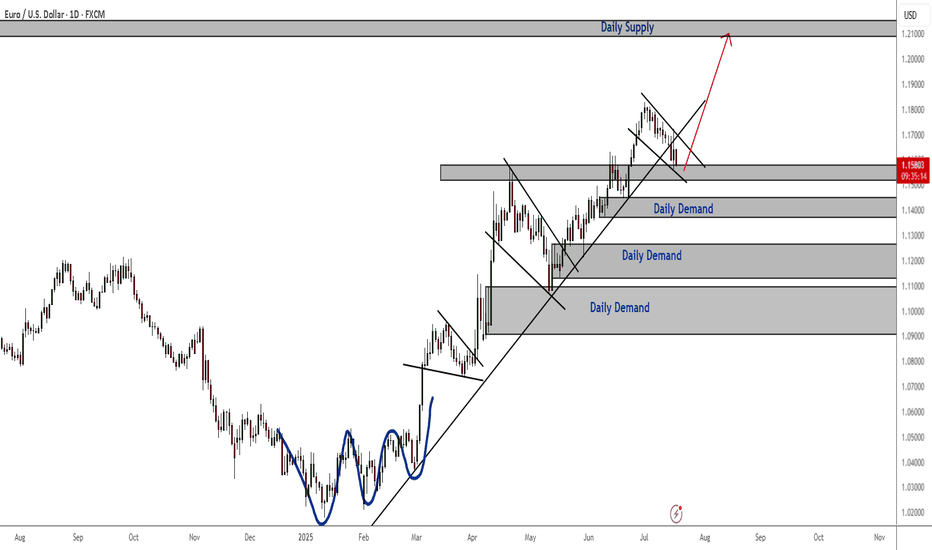
The bullish continuation patterns and the consistent daily demand zones indicate that the trend is still bullish despite last week's bearish correction. Price is currently reacting to a daily support zone. To confirm going long, especially long term, I recommend waiting for the current falling wedge to breakout and retest and then ride the bullish momentum to...
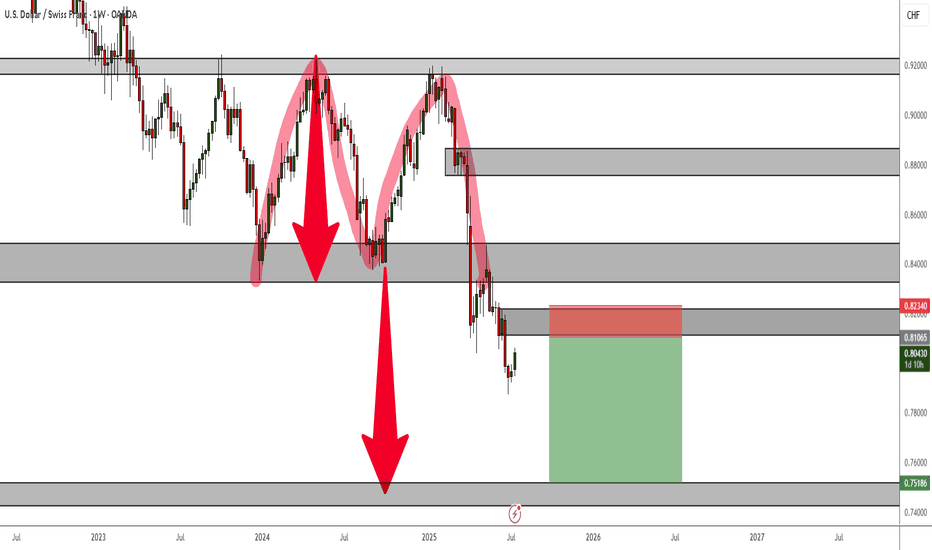
A Double Top Rejection on the weekly TF is currently at play and despite the current bullish correction, the trend is still very much bearish. For long-term or position traders, this is an ideal setup to take and hold.
The plan for Dow Jones has not changed. Price is still in an H4 demand zone. As soon as price breaks out of this bull flag, nothing will stop the bull run and new All Time Highs being claimed. Don't miss it.
Although price has been consolidating between a daily resistance and support, I am currently seeing multiple rejections in resistance and bearish candlestick patterns that indicate pressure to the downside will soon follow. A rejection in the current highlighted resistance and a break of support will take price to weekly demand. Always wait for the right...
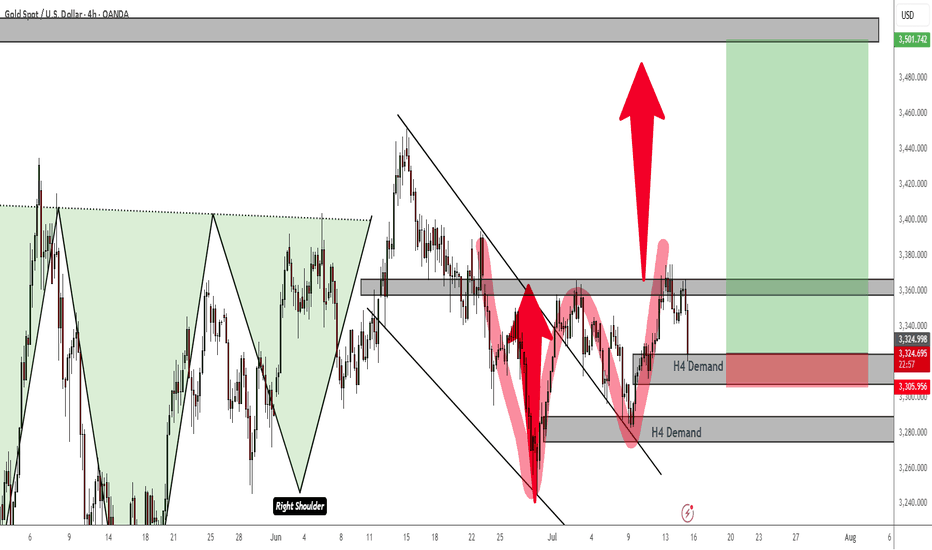
There is currently a double bottom rejection pattern at play and price is reacting to an H4 TF demand zone. Confirmations to go long will be in this demand zone or the next one. But my money is on the current one. Best thing to do is wait for an M15 supply to break to validate taking longs from the current demand. But the bulls are showing strength.
Another bullish breakout on the H4 TF is pending. The trend has been consistently bullish and confirmations of a continuation are clear. Wait for that breakout of the bullish pattern and ride the trend.
Price is currently being supported by an H4 demand zone. If this demand zone continues to hold and apply pressure to the upside, we will soon be seeing new all time highs. Which really should not surprise us because as we all know, indices are generally bullish long term.
The overall trend is still bearish. Confirmation to short is on breakout and retest of the bearish continuation pattern. Short term targets are in H4 and Daily demand zones and long term target is the weekly demand zone.
The trend is no doubt bullish here. But in the event that the current H1 demand is violated, there is a high probability of a retest or pullback to an H4 demand zone before the bullish trend resumes.
This quadruple top rejection pattern on the H1 timeframe is currently in play and it is a strong indication or confirmation that the bearish correction will likely resume next week. If you are unsure when to enter short positions for this trade setup, wait for a demand zone to break, followed by a pullback and continue to ride the bearish momentum and target the...
There is no denying that the overall trend is still bearish. However, price is currently respecting an H4 demand zone - which might continue to apply pressure to the upside for a minor correction. Of course, if this correction does not happen and the H4 demand zone breaks, then we continue to ride the trend to the downside and all the way to the next weekly TF...
The daily timeframe bullish flag is a strong indication that the market is preparing for another bull run. The target for this will be around $140k - slightly higher. I am anticipating a minor pullback to either one of the daily demand zones - (most likely the highest one) before the bulls take over.
That inverted head and shoulders pattern on is what is still giving me the confidence that the bulls will soon take over this market with a high probability of new All Time Highs. At the moment however, I am patiently aways the possibility of a retest to the H4 demand zone as indicated by the downward pointing arrow. The bullish move might only happen in ful...
Looking at the daily timeframe, I am still seeing strong signs of a bullish confirmations. Firstly that daily support zone has been rejecting the bears' efforts since the beginning of this month and now we have a 3rd touch of the support trendline. As long as that daily support zone continues to hold, I remain bullish overall. Even if there still consolidation...
