MoneyForNothingAndPipsForFree
Here's what I see for this pair. Looks like an attempt to come back down to the 11.32000 level.
I think we're in the process of finishing the cup and handle formation on the daily chart. Looks like the bull flag is complete and price should move to 95.800 , retrace and then take out the order block at around 100.500. The measured move is the potential move the upside aka the length of the flag pole.
Looks like we're going up once the blue trigger line is crossed. My target would be the 38% Fib / pink box. You can see on the chart that it's a key point of interest as it has been touched many times before.
Just a quick idea before I hit the sack. My trigger to go long got activated. Take profit is inside the pink box, which gives us roughly 160 pips.
I have a short position here and that the trade here is pretty much straightforward. Also the MACD histogram has turned negative and given us bearish convergence with price action.
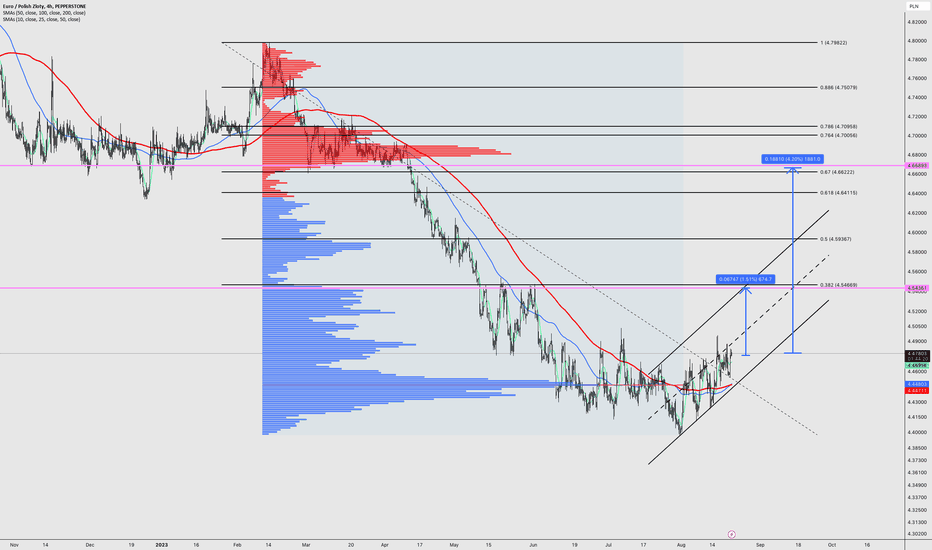
EURPLN has finally bottomed out, created a nice round bottom and is starting to crawl upwards. Price is trading above both major moving averages (100 and 200) on H4. As you can our first target should be the 38% Fib retracement and our second longer term target is around the 61.8% Fib, just near the volatility gap.
Here's what I see for this pair. We have created a textbook double bottom and are about to fill the volume at around the 50% recent zone. Also MACD is giving us a bullish convergence. I have marked the take profit zone for you guys, it's the area between the two pink horizontal lines.
Here's what I see for this pair. Keep shorting and hold for the target.
Get ready for another massive AMC pump. My conservative target is around $10. We have a Bullish convergence on MACD, price is trading above the fast moving averages (11,25,50).
Very bullish setup on ACB today, a Wyckoff spring (liquidity tap) has formed. We have a nice "b" volume profile with lots of volume imbalances at higher price levels. On top of that the MACD histogram is showing a bullish divergence. I have marked potential take profit areas (pink boxes).
Here's what I see. You can initiate a long position at wave 4, I expect a reversal from there. My longterm outlook remains bearish, though.
PLUG had a nice run up in a textbook 5 wave structure. I expect it retrace now to somewhere around $9 - $10. I've market two potential buy zones (the pink boxes). 9 and 10 bucks is where the most trading took place, so we shouldn't drop beneath that area.
Here's what I see for AFRM. Although we're def. in an a up trend I think we're going to see a leg down to around $12 -$13 before it rips to $20. My long term outlook is at around $40 for AFRM. We have a bearish divergence on the MACD histogram which gives us a heads up in which direction the stock is about to move.
As you can see XLM has completed a nice break above the first TD line and I'm waiting for a hook to touch TD1 or the red MA. From there I expect XLM to move to around 24 cents. If you take a look at the structure from Feb 2019 - Nov 2020 you'll recognise a striking resemblance with the current structure. Wait for the right shoulder to finish forming (touch of TD1...
Here's what I currently see for Nikola. We made a nice 5 waves up and it's time now to retrace so we can start another leg up. I think the area between $1 and $1.50 is where the big boys will be loading up. It's also a put wall. From there we should rip to around $5 easily.
ETC is finally leaving the 2 year bull flag formation. TP is at around $40.
I'm pretty sure we're going to see a new alt coin rally and Dogecoin will be part of it. It you look at the weekly chart it's extremely coiled and it's only a matter of time before it rips. My first TP is at around $0.15 where I will exit my position , wait for a retrace and go long again and hold until it reaches around $0.27-$0.28.
We're trading inside a nice downward channel and the 100 MA on H4 got breached. The first target is the pink box. Happy shorting.


