The 3rd wave in EUR/NZD appears to have been completed, and the market seems to be entering the 4th wave. There is a possibility that the 4th wave could take support near the Fibonacci 0.5 level (1.19164). After that, the 5th wave of the impulse phase may move upward. If the market falls below 1.98303, it would confirm the beginning of the 4th wave. In that...
The corrective phase is complete and an impulse move appears likely. A strong buy above the A-B-C channel could target levels around 30 - 37 - 45 or higher. Good entry is possible above 26. However, if conditions worsen, further corrections may ensue. I will update further information soon.
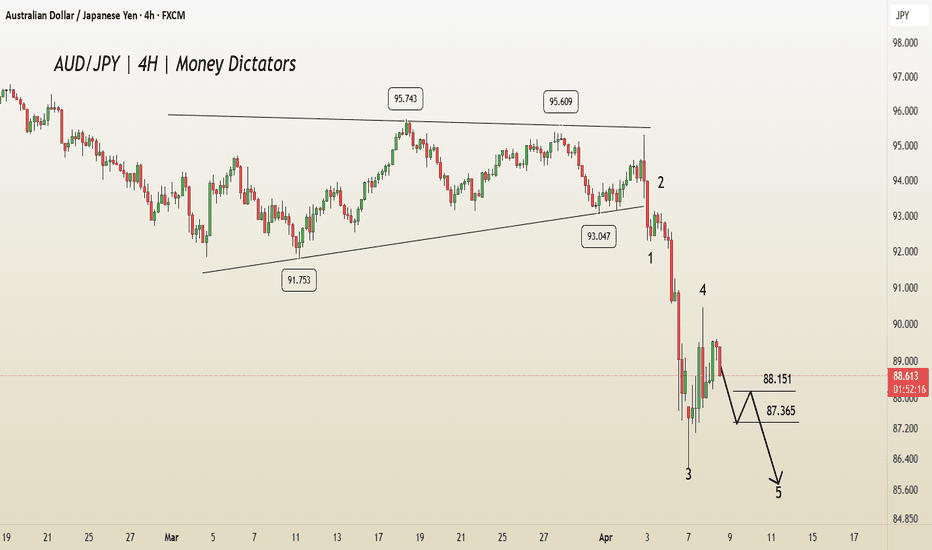
In AUD/JPY, the 4th wave has been completed, and the 5th wave is in progress. According to Elliott Wave theory, there is a high probability of the market continuing its downward movement. Regarding potential targets, the price may reach 88.151 and 87.365 on the downside. However, a bullish move could also emerge if the market breaks above 89.645 .
TF: 4h NFLX appears bearish at the moment. The corrective structure on the 4-hour timeframe suggests a potential decline. The current formation indicates that wave B likely completed at 998.61 , and the stock has now begun its descent into wave (C) of the correction. The correction may extend to the 100% projection of wave A at 788.67 , or potentially deepen to...
This EUR/JPY daily chart shows an Elliott Wave analysis, suggesting a possible bearish continuation. The current wave structure indicates the pair is moving through the final phase of a five-wave impulsive sequence. The market has completed three waves of a larger impulsive cycle, with Wave (4) The price movement between Wave (2) and Wave (4) shows a pause or...
In the 4-hour AUD/USD chart, strong supply and demand zones are visible. A significant demand zone is observed around the 0.62269 level. Within the chart, a Change of Character (ChoCh) is identified from the 0.6323 level, and a Break of Structure (BoS) is noted at the 0.63211 level. A strong selling reaction has been observed from the supply zone, and the...
NVDA appears to be nearing the completion of its corrective phase, setting the stage for a potential move to new highs. The current pattern resembles a falling wedge, indicative of an ending diagonal formation, which often signals a reversal and the start of an upward trend. The structure of the corrective channel, along with the termination of the diagonal...
On the 1-hour timeframe, XAU/USD has formed an Elliott Wave corrective structure. This is an expanded flat correction, typically seen in the 4th wave. The correction seems to have been completed at 3,054, suggesting that the 5th wave may be in progress. For bullish traders, a potential long position can be considered around the 0.236 retracement level as a...
This EUR/USD 4H chart presents an Elliott Wave analysis, showing the market’s movement within a five-wave structure. The price has completed Wave 3 and is currently in a corrective Wave 4, finding support around Fibonacci retracement levels of 38.2% • Wave 3: A sharp rally forming an extended third wave. • Wave 4: An ABC correction is currently in progress and...
------------------------- Timeframe: 240 Min ------------------------- The price action suggests a completed impulse structure originating from the 2833 low, with gold now trading at an all-time high. Based on cluster zones and Fibonacci extensions, wave (5) still has the potential to extend toward the 3150-3200 range. This zone represents a key resistance...
TF: 4h GBPCAD is initiating along opportunity by completing 4th intermediate wave at 1.83464 . We can expect a retracement then reversal with near the lower trendline of the parallel channel. Once price comes down, we will have the opportunity to go long with minimum stop level at low of the wave 4 at 1.83640 . The bullish scenario is capable GBPCAD to...
This GBP/USD 4H chart presents an Elliott Wave analysis. Wave (1) and (2): The market had an impulsive bullish movement in Wave 1, followed by a corrective Wave 2. Wave (3): A strong bullish move with momentum. Wave (4): A corrective phase, forming a triangle pattern (a-b-c-d-e), which suggests the market is preparing for another impulsive leg. Entry...
Nifty recently hit a low of 21,905 , marking a key reversal point in the trend. A well-defined Head and Shoulders pattern is emerging, with the right shoulder currently forming. The ongoing pullback has retraced to the 38.2% level, but there is potential for it to extend towards the 50% mark at 22,906 . However, the upward move appears to be losing momentum,...
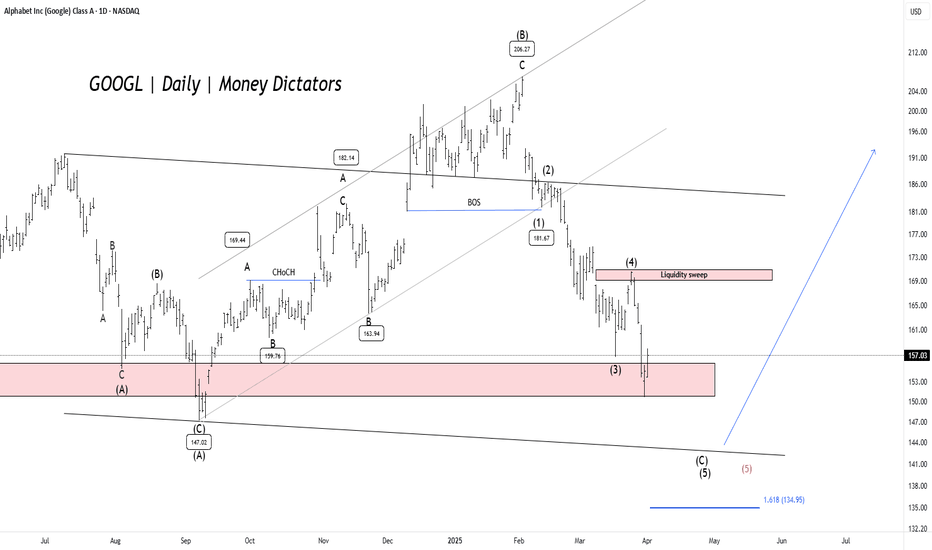
GOOGL has dropped over 27.28% , reaching a minor profit-booking zone. The $150 level serves as a key demand zone, where a potential price reversal could occur. The formation is either expanded flat or a running flat on the daily timeframe chart. Confirmation is best observed near the lower trendline of the parallel channel. If bearish momentum persists, prices...
Bitcoin's wave ((4)) has successfully completed a W-X-Y corrective formation. If Bitcoin manages to decisively break above the key resistance level of 88,826, it could trigger a powerful impulsive rally, potentially driving prices toward the next major targets at 95,250 - 99,508 - 109,176. Additionally, the parallel channel's lower trendline is offering...
---Elliott wave analysis--- As you can see on the daily chart, There is an impulsive cycle from the low of 5960 that validates all the required rules of the Elliott wave principle given below: Wave (2) can never exceed the starting point of wave (1). Wave (3) can never be the shortest wave among (1), (3) & (5). Wave (4) can never enter the price territory...
The concept of compounding power pertains to an investment's ability to generate returns not only on the principal amount but also on the accumulated interest over time. Various investment options leverage the power of compounding, where the earned interest is added to your initial funds. What is Power of Compounding? The essence of compounding lies in the...
Disclaimer: Warning! The given tips are born from the minds of financial disasters and for entertainment purposes only. These are the results of the imagination of unsuccessful traders with a knack for making impressive losses. These master traders are known to make their financial mistakes by making huge losses. Unsuccessful traders are honored members of...


