Mrwarm_
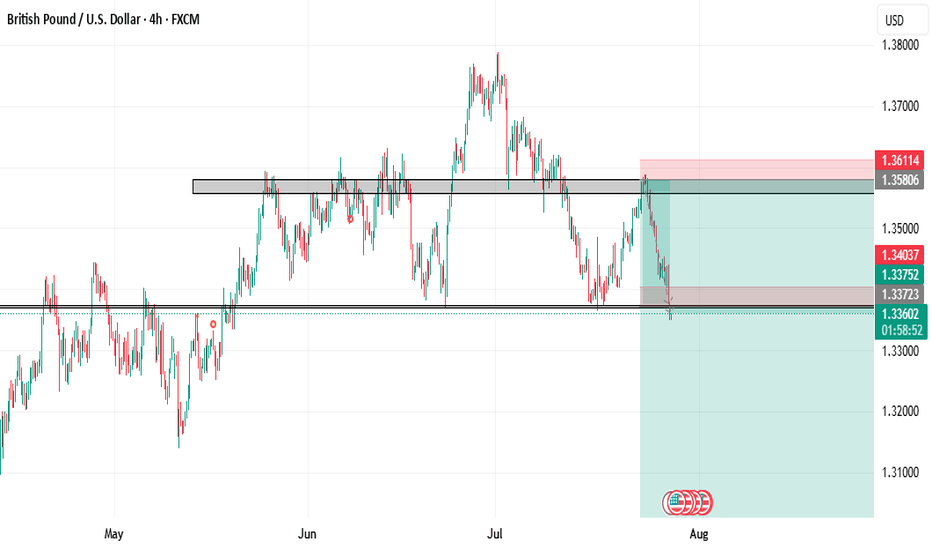
PremiumIs trading not beautiful? I hope we can say that both in our wins and losses. Back to business, this is just a continuation of the sells. As you can see, major support has been broken on the H4 chart, and a retest is incoming. A complete retest would be room for an entry to the next low—best of luck guys.
TREND: Downtrend The price is currently retesting broken support on the H4 and Daily charts, indicating continued selling. Based on the strong bullish pressure currently, I'll be looking for a confirmation signal to sell at the next H4 close.
This is just a retracement for an entry for a further move downwards. Since it's a ranging market based on the daily chart, I'm looking at further sells to the major support zone, 3233.8
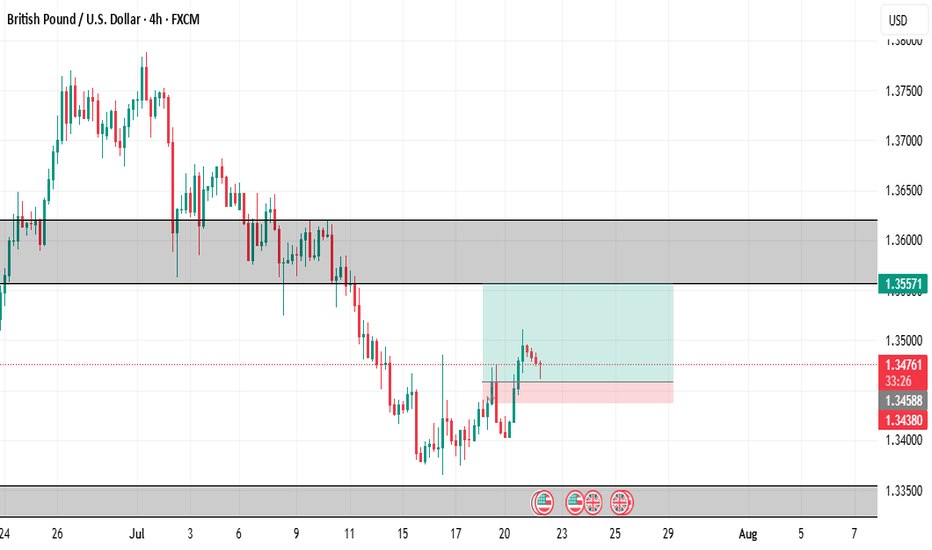
We're currently in a downtrend, but the price is approaching a key reversal support zone. Based on previous price patterns in that support zone, the price has consistently reversed upon reaching it. We'll be on the lookout for signals the market sends at the zone
Daily chart - Head and shoulder pattern formed (Trend reversal pattern) I'm looking at further sells this week below the incoming support this new week. This will only be valid after a break and retest below the support level on HTF(H4 & Daily)
TREND - UPTREND What's currently happening is a retracement/retest of the previous high for continued buys to the next resistance. H4 close will be confirmation for entries
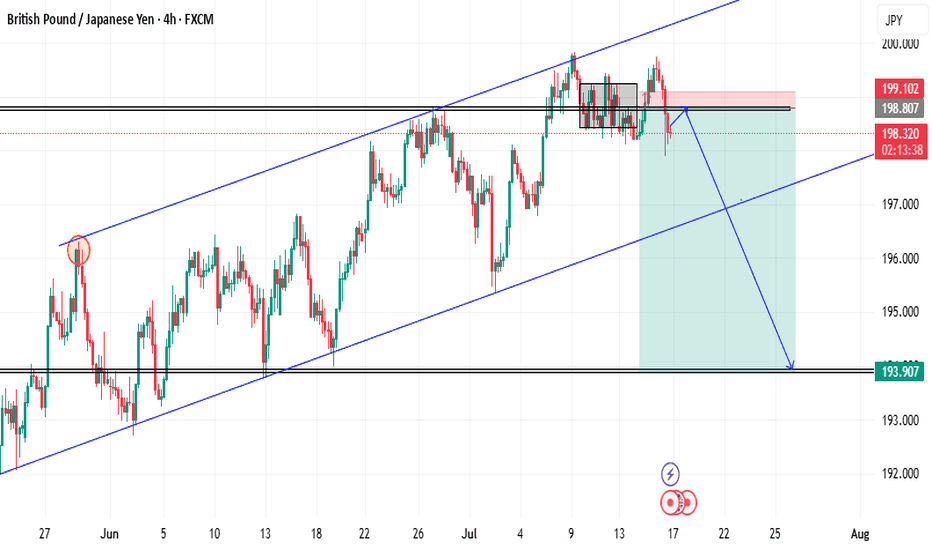
Price is currently forming an Ascending channel on the Daily chart. Current trend - Downtrend with price approaching a major support after recently forming a lower high. A break and close of the candle below the support level on the daily chart and retest on lower Tfs would be confirmation of a downtrend, formation of a lower low, and entry for a...
The break of the support level on the H4 is complete. Looking at the retest of the broken support for the continuation of the fall
- Weekly chart - Ranging market with price forming a double top before falling from the resistance. - Daily chart - Ranging market with strong bearish fall. Price didn't respect the bullish trendline as well. - H4 chart - Price is forming a series of LHs and LLs and currently testing a minor support level for further fall. Entry would be close below the minor...
- Weekly chart - Price reached an ATH on the weekly and closed below the major resistance with upward wick rejections - Signal for a downtrend for the new week - Daily chart - The Last two daily closes (Thurs & Fri) were an inverse bearish pin bar and a weak bullish candle with upward wick rejections - H4 Chart - Consolidating at the major resistance, but last...
Price is forming a head and shoulders pattern on the daily chart. The right shoulder is currently forming, with a minor resistance being tested on the H4 chart. I'll be on the lookout for a signal for entry at that level.
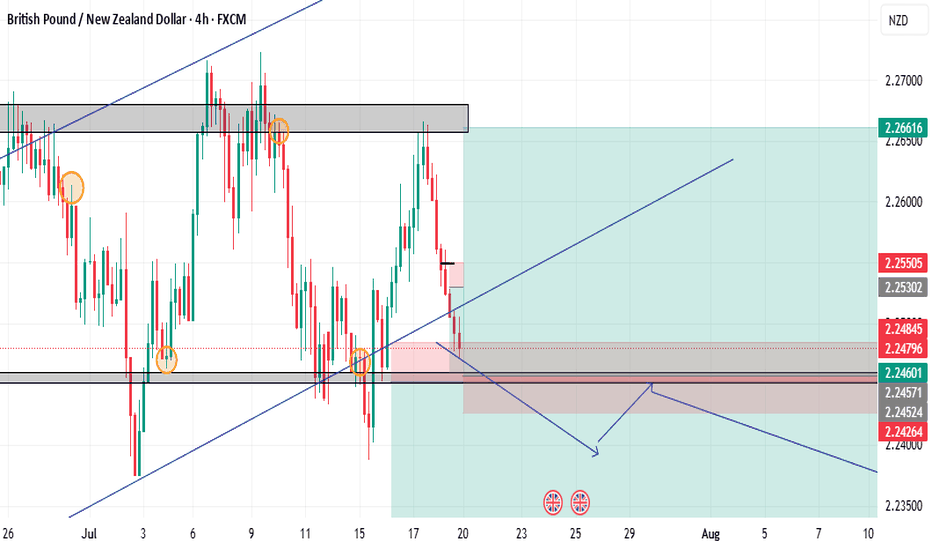
We're currently in a downtrend with price forming a series of lower highs and lower lows. Currently, the price is retesting a broken minor support level on the H4 chart, and I'll be on the lookout for entries at the next H1 close. Final confirmation for a fall would be a H4 close below the support level.
Price reached a daily resistance last week and respected it. The price was consolidating and finally broke the previous low (support) on the H4 chart, forming a lower low and signaling the beginning of a downtrend/fall. I'm on the lookout for a retest of the broken support on H1 for entry for a sell to the next low. Risk - 30 pips Reward - 172 pips
According to the Daily Chart, we're currently in an uptrend. Price broke a major resistance level, 2.25511, yesterday and continued without a retest. I'm looking at a retest of the broken resistance for continued buys.
Hope y'all caught the 300 pips buy move last week. Mehn, that was fast. Well, price is a major resistance and is currently retracing. The question is whether price action is retracing for a further move upwards or a fall back to the support level at 2.2233? The chart pattern is showing a falling wedge. A break of resistance 2.25 and retest would be confirmation...
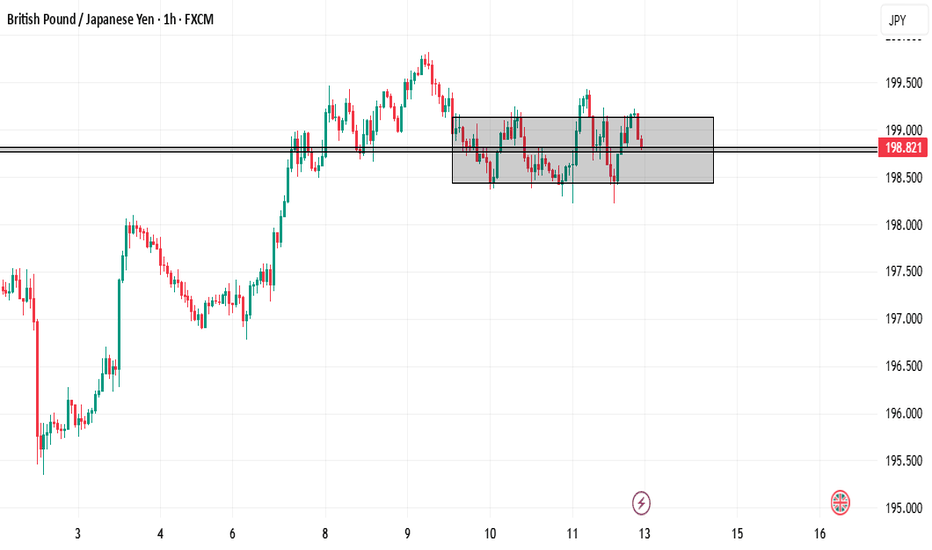
- This is a continuation of the buy trade last week. The price has broken above the major resistance on the H4 chart and is now slightly above the previous high on the daily chart. - We're looking at a retest of the broken resistance for entries for further buys. For those who missed my previous analysis on it, please revert to my previous idea on GBPJPY buys.
- According to the daily timeframe, the market is ranging, forming lower highs and lower lows on H4 AND H1 TF. After consolidating for a while, the price has broken out and is currently retesting a broken minor support for a fall. Close of the H1 candle would be an entry for a sell.
