MyTradingJournal6th
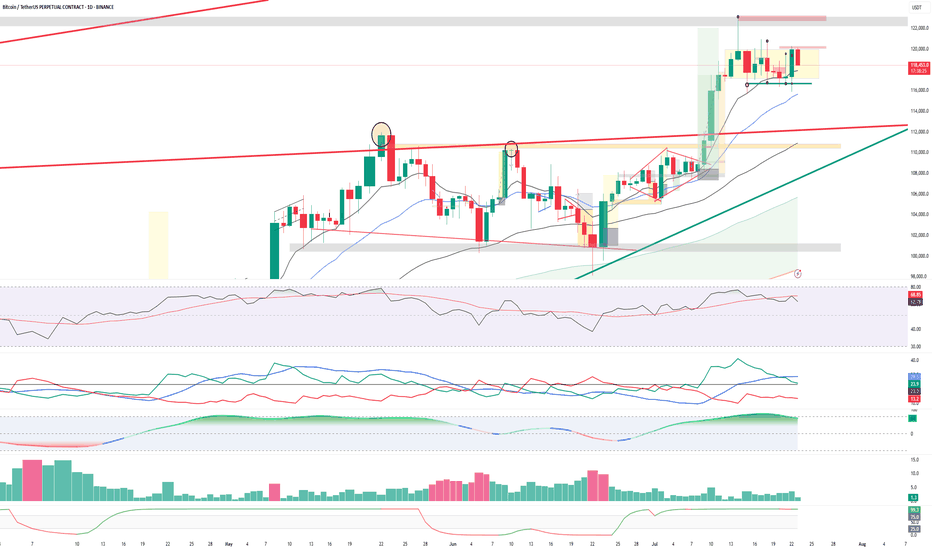
PremiumBitcoin is currently consolidating between $117,000 support and $120,000 resistance, forming a tight sideways range after a strong breakout. 🔹 Structure Insight: Bullish rally stalled at $120K resistance zone. Range-bound candles with wicks on both ends = indecision. Strong demand zone near $117K, acting as short-term floor. 🔸 Indicators Flash Neutral...
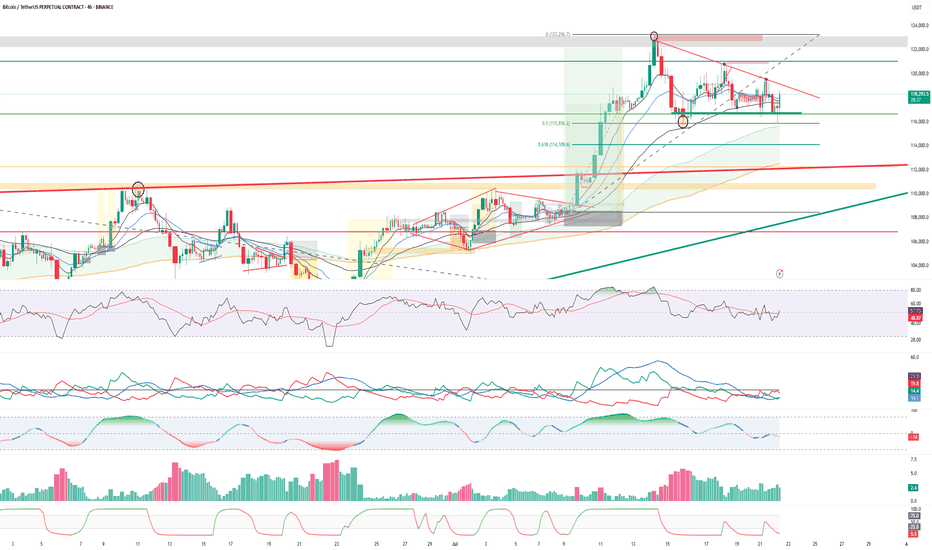
🔹 Price rebounded strongly from key support at $116,400 🔹 Approaching breakout zone near $119,500 🔹 Descending trendline and multiple rejection wicks being tested 🔹 Bullish momentum building — RSI rising, MACD stabilizing, volume uptick visible 🔹 ADX shows trend strength picking up 📈 If breakout confirmed above $119,500: 🎯 TP1: $122,000 🎯 TP2: $127,000 🎯 TP3:...
The structure forming from June 27 to July 8 appears to be a diamond top, a reversal pattern often seen after uptrends. Price expanded (broadening left) and then started converging (right side) — classic diamond symmetry. It has developed right at the macro trendline resistance (~109.5K), increasing its reliability. Volume has declined during the right half of the...
Structure & Price Action BTC is consolidating within a symmetrical triangle (red trendlines). Price is squeezing near the apex, suggesting an imminent breakout. Strong defense at ascending channel support (~108K zone) + green trendline. Lower highs indicate sellers still active, but higher lows reflect buyer strength too. Price bounced from previous demand block...
🔍 Structure & Price Action BTC is trading within a rising wedge (blue lines) nearing apex — typical bearish setup. Price is repeatedly getting rejected near macro trendline (~108.8K–109K). 30-min shows clean breakdown from lower wedge support, retesting the zone now. On 4H, BTC is still under key resistance zone between 109.6K–110.4K, previously rejected...
Timeframe: 4H | Exchange: Binance | Date: July 🧠 What’s Happening? Bitcoin just fired out of a bullish wedge with strong volume and is marching inside a clean rising channel. All eyes now on the golden Fibonacci zone — and beyond! 🎯 Key Levels 📍 Immediate Resistance: → $109,940 – Holding at the 0.5 Fib → $110,580 – $111,491: Golden Pocket (0.618–0.786 Fib) →...
Price Action: BTC rejected from Fib 0.5–0.618 zone (110.2K–111.5K), aligning with rising channel resistance. Failed breakout attempt above local highs (~109.6K) → price sharply reversed. Clean breakdown from rising wedge/channel support (blue) and EMA cluster. Support/Resistance: Immediate support at 107.5K (red horizontal) now under pressure. Next key support:...
BTC got rejected again at macro trendline (~108.5K) Multiple lower highs → selling pressure confirmed 4H breakdown from compression with volume spike Now hovering near 106.5K — key support 🔻 Below 106.2K = clean short trigger → 104.4K–102.5K ✅ Reclaim above 108.2K flips bias bullish ⚡ Market Context Large treasury interest building (institutional buying...
BTC just bounced cleanly off mid-channel support (~106.8K) within the descending structure. Held above EMAs and reclaimed key short-term support. If price holds above 107.2K → likely retest of 108.4K channel resistance. Break and close above 108.5K = trendline breakout → 110K+ possible. Break below 106.8K = failed bounce → 105.5K next demand. Bias: Bullish while...
Breakdown from 30m rising wedge confirmed with volume. Retest at 107.5K failed. Price now under EMAs. 4H also broke rising channel → rejection from 108.4K. Key support: 106.4K. Break below = 105.2K target. Reclaim 107.5K = upside risk to 108.8K+. Bias: Bearish below 107.5K. Volume confirms move.
BTC 30m chart shows ascending wedge, followed by a bullish retest of prior resistance (now support ~107.4K). Price now consolidating just under diagonal resistance near 108.8K. EMAs are aligned bullish, volume surged during the breakout, and remains elevated—suggesting further upside potential. 🔄 Higher Timeframe Confluence 4H: Price pressing upper boundary of a...
BTC 30m chart shows clean ascending wedge, followed by a bullish retest of prior resistance (now support ~107.4K). Price now consolidating just under diagonal resistance near 108.8K. EMAs are aligned bullish, volume surged during the breakout, and remains elevated—suggesting further upside potential. 🔄 Higher Timeframe Confluence 4H: Price pressing upper boundary...
Summary Bitcoin is showing a classic multi-timeframe confluence setup. On the weekly chart, BTC is holding above key EMAs with bullish continuation patterns. The daily chart shows a breakout from a descending triangle, while 4H and 30-min charts confirm a narrowing price wedge inside a larger compression zone. Momentum is rising, but volume remains subdued. A...
Bitcoin is pressing into the apex of a descending triangle, anchored at $102K. Volume is drying up, EMAs are compressing, and liquidity pools sit just below. This structure rarely resolves quietly — a volatile breakout is imminent. 🔻 Bearish Case (Primary Bias): Breakdown below $102K = short trigger Targets: $98K → $94K Stop: Above $106K Confluence:...
📊 Market Overview: The crypto market often moves together — but BTC, ETH, and SOL are telling 3 very different stories right now. From Bitcoin’s coiled spring to Ethereum’s indecision and Solana’s struggle — this divergence could define the next major trend. 1️⃣ Bitcoin (BTC): The Market’s Trigger BTC is tightening in a Symmetrical Triangle after a powerful...
🧭 Summary: Solana is coiling inside a symmetrical triangle after rejecting from its 2025 high. Price is trapped between $ 141–$ 167 with squeezing volatility, falling volume, and visible double top signs. The setup screams: “get ready for a breakout — or a breakdown.” 🔥 Key Confluences: Eye-shaped compression pattern on 4H & daily Support at $ 141 (trendline,...
⏳ Summary: Ethereum has been moving sideways for 6 straight weeks, printing back-to-back doji candles — a rare phenomenon in any market. Price is trapped, pressure is building, and volatility is near its breaking point. History shows: after this much indecision, a violent breakout is almost inevitable. 🚨 What’s Happening? 6 consecutive weekly dojis — this kind of...
Idea Summary: Bitcoin is compressing in a rising wedge on 1D/4H timeframes, approaching resistance around $ 110K–$ 112K. We’re seeing bearish divergence on RSI and MACD, declining volume, and sentiment cooling—signaling a potential breakdown. Key Confluences: • Rising wedge pattern (bearish reversal during uptrend) with converging trendlines and falling volume...


