Olajireolapoju
EssentialIf you look at this very closely, you would see that the monthly candle of June 2025 already closed above June 2020 after 5 years exactly. That was very instructive. However, there may be opportunities for sell as counter trade as we are currently seeing some rejections that can be seen more clearly in lower timeframes. Nevertheless, I am ultimately bullish and...
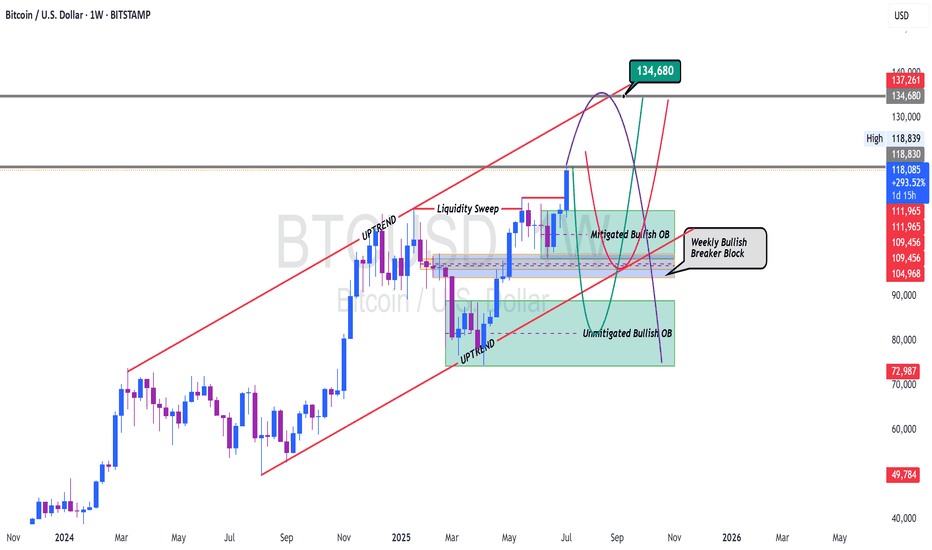
Weekly simply shows there are more rooms for BTC to continue the uptrend but lower time frame will let us know better as there may be pullbacks however, we need the weekly candle close above the most recent high of $118,900 to give us that immediate confirmation. So as not to get trapped by the bears, the best way to trade the buy for BTC is to have a buy-stop...
I my opinion that based on my 4H analysis, Gold will retest $3,451 in the coming week but we need to pay attention to those daily key support zones. Gold usually does deep retracement and that makes the unmitigated Bullish OB a good zone for patient buyers/ Play safe.
The Buy set up remains higher probability set up till we get a bearish confirmation and if that happens very instructively, then the extreme POI would be a great TP target and the next higher probability buy trade set up
Dear Traders, Whilst I believe that BTC is still generally bullish, I also think it is important for traders to always pay attention to what price is doing and not what we think price is going to do, and this is simply what we mean by price action in simple terms. As we can see, the bullish momentum is generally slowing down and we have seen three attempts...
DXY might just drop to previous low of May 2021 at the 89 if this weekly downtrend continues
As DXY has violated key support zone. 94.648 which appears to be the next key level must hold, otherwise we may be approaching the 89 zone.
Dear Traders, In my personal opinion, BTC may just create another Lower Low (LL) before a new bullish run or before creating a new All-Time-High (ATH). Paying close attention to price action, there are so many overlaps of Institutional reference points around the zone price is current at the moment and there are three clear ones that are yet to be mitigated....
In my last BTC idea, I simply mentioned that I would remain bearish on BTC until I see a closure above the most recent high of $112,000. Right now after BTC failed to close above the previous high, we have been seeing some bearish movement and now the king of crypto is trading the uptrend line. We also saw a pullback toward the trendline but the price of the...
GU still bullish still bullish overall but i will wait for bullish close above the Fib to look for new bullish entry
BTC has been stuck within the bearish mitigation block for over 24 hrs. I see the possibility of pull-back to retest the previous low
I am bearish on BTC until a strong bodily close above the bearish OB to confirm Bullish and possibly a new High
Dear Traders, Most times Retail Traders lose trades because their emotions overpower price action. From the daily chart again, it is quite obvious why I mentioned that I am still bullish until Gold Closes strongly below $2,345. Until then, I will keep looking for bullish price action above that level until gold proves otherwise. It is usually good to pay...
I am still Bullish on Gold till we close strongly below $3,245
I am of the opinion that BTC may continue with the downtrend. We are already seeing several daily candle closing below the trendline but the FVG is still not violated. If the weekly candle closes below the trendline with an aggressive bullish candle and the next weekly candle closes below the FVG, then we should be ready for more downside probably back to the...
This Seems simple enough to understand. As long as price stays above the trendline, Gold may continue higher. As you can see, liquidity has been drawn below the trend line into the ODER FLOW with that Bullish PIN that created the External Structure Low (ESL)
I have been in the current bearish trend since above $3,160 and if this bearish momentum continues, We might see price hit the Bullish OB in the discount zone on my Chart and if that continues after reasonable and valid pull back probably next week, then we may just see Gold retest $2,830 - $2,833 zone
I have made significant profit from gold selling from above $3,161 to $3,086. Now it is just safe to wait for a closure below $3,053 to confirm bearish continuation and sell at a restest after some bearish chart pattern to further confirm and enter.


