PFabrik
Okey, by now it should be clear. XLM will eventually drop back to 0.5 USD(supported by the trendline, break of the trendline will almost certainly indicate longer consolidation period), there we have our buy signal. Our sell signal lies at around 0.77 USD. This analysis was done solely on previous price movements, I have not identify any patterns or indications of...
The LTC has formed head and shoulders pattern. It will most likely drop to 120USD, alternatively it may be supported by the 200EMA.
Look at the similarity between between the smaller red triangle and the green triangle. They both started with 120USD rejection and, continually ascended, then broke and the price tested the upper red trendline
After recovery from recent loses, it seems like there is a strong resistance around 140USD level. Price is now trying to fall below the 50 moving average on the hourly. If It manages that, Adam and Eve pattern seems to be almost inevitable.
From short time perspective it looks like LTC is getting ready to break the downward wedge, heading all the way up to 150USD. From long term perspective we can see the downward flag, last component of large cup and handle. My idea is to buy now, sell at 150USD, wait for the price to break/confirm the flag and then go long . RSI and Momentum were already yesterday...
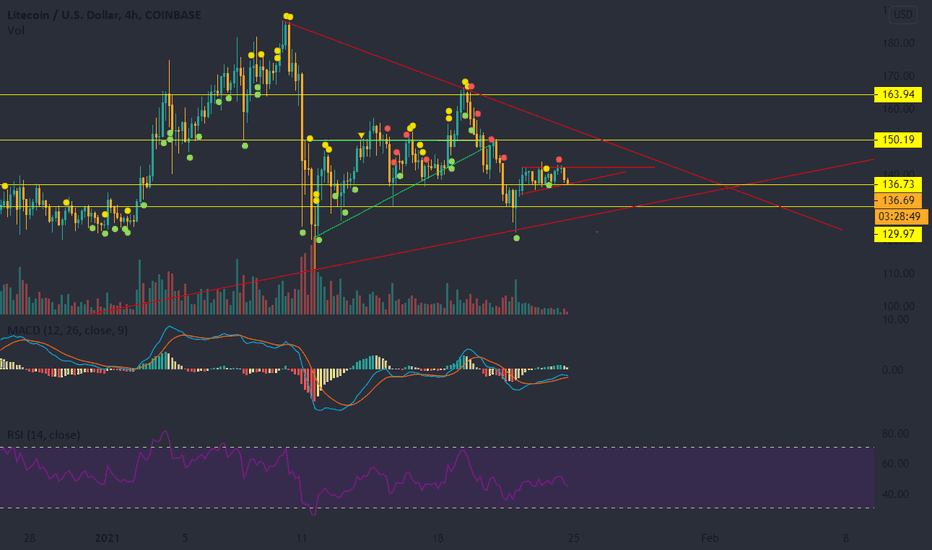
LTC appears to be traveling in a downward wedge formation and has managed to found a support at 130USD, the volume is and price are rising. If the wedge's upper boundary is broken, we might expect price to rise as high as 160 USD.
In the future, trends for Ethereum seems to be contradicting themselves, while longer trend shows price contraction (rising wedge), recent trend seems to favour upward channel. If the upward channel were to prevail, we could expect price to reach as high as 2000 USD within few days!
Head and shoulders pattern has just been confirmed on the hourly. The RSI and momentum also indicate a strong bearish downtrend. This downtrend should continue all the way down to 125USD, where the next major support level lies.
Right now Ethereum seems to have broken the downtrend and by that closed the peak. Now it seems to be going to test the larger downtrend around 1010 EUR level. From that it will either break the triangle and test the 1080 EUR level. Alternatively if it gets rejected by the downtrend, Ethereum will probably break its long-time uptrend, forming Adam&Eve pattern in...
Litecoin has tested the 145USD support level, it is on its way to complete the double bottom continuation then it will probably break the 154USD level. That will give it the momentum necessary to reach 161 USD resistance. The stochastic indicator is currently in the oversold area, choppiness index is on its way above 61.67. Last time this happened on the hourly we...
In my previous post I have outlined the possibility of Litecoin forming Adam&Eve patern on 4 hour charts. I believe that when the price hits 170USD, there will be a small retracement to the 162USD mark, then the faith in the newly recovered Litecoin would carry it to test the 180USD mark.
There is an Adam and Eve pattern forming on the 4 hour chart. If we brake the 145 USD resistance level, next resistance level lies all the way up at 170USD.


