PIPsOptimizer
Chart Pattern: Head and Shoulders Formation The chart shows a potential Head and Shoulders pattern, which is a bearish reversal setup. The head is the highest peak, while the two shoulders form lower highs on both sides. The price has already broken below the neckline, indicating a sell opportunity. Key Levels: Resistance Levels: $3,055.29 – Major...
Key Observations: Rising Channel: The price was trading within an ascending channel, bouncing between resistance and support. Breakout & Sell Signal: The price has broken below the channel support, indicating a potential trend reversal. Bearish Target: The next key support level is around 1.27024, aligning with a previous demand zone. Confirmation: If the price...
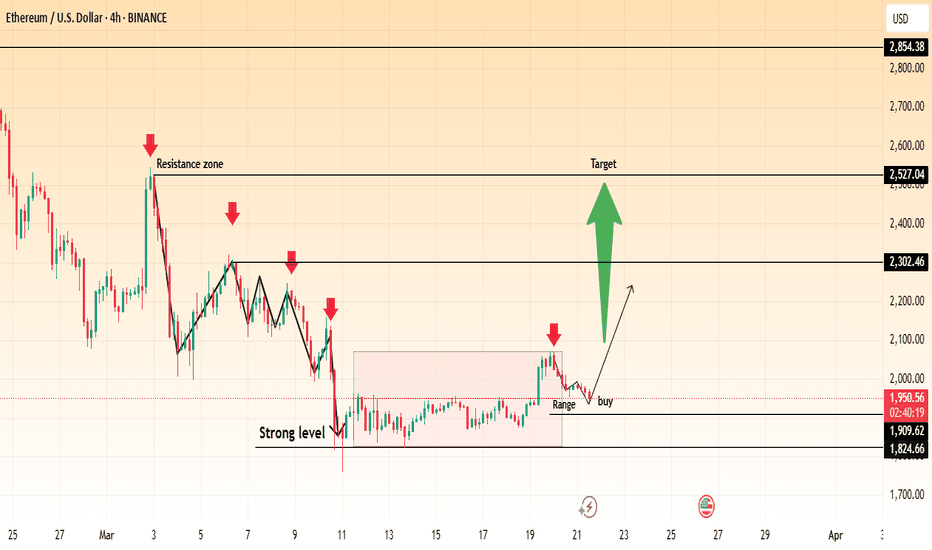
📊 Chart Insights: ETH/USD is currently ranging near the $1,950 zone, following a consolidation phase. A strong resistance zone is visible between $2,302 - $2,527, which has historically acted as a rejection point. Support levels are established around $1,824 - $1,909, forming a strong base for price action. A breakout above the current range could signal a...
Analysis Overview The 4-hour chart of Gold (XAU/USD) shows a possible head formation, indicating a potential trend reversal. The price has faced resistance near the 3,053 level, leading to a rejection. The current price action suggests a bearish movement, with a possible downside target at the support zones marked in the chart. Key Levels: 📍 Resistance: 3,053 📍...
Key Observations: Descending Wedge Breakout: BTC has been trading within a descending wedge pattern, which is typically a bullish reversal formation. The price has now broken above the wedge, signaling potential upside momentum. Buy Setup: A buy entry is marked around $83,900 - $85,000. The stop-loss is placed near $79,154 - $80,000, just below the previous...
Key Observations: Uptrend & Resistance: The price has been trending upwards within a parallel channel. It reached a resistance level around $3,064 - $3,055, where selling pressure is evident. Potential Pullback: The price is showing signs of rejection at resistance and could move lower. The first target for the pullback is around $3,013 - $2,964, which aligns...
This Gold to Euro (XAU/EUR) 4-hour chart shows a breakout from a descending channel, followed by a strong bullish rally. The price has now reached a key resistance zone, where sellers might step in to push prices lower. Key Observations: Downtrend Channel Breakout: The price was previously moving in a downward sloping channel but has now broken out, signaling...
The EUR/GBP pair has shown a significant shift in market structure, breaking below a critical support level and signaling further downside potential. After facing strong resistance near the 0.84400 region, the price struggled to maintain bullish momentum and started forming lower highs, indicating selling pressure. Technical Breakdown: Resistance Zone: The upper...
Overview: Pair: EUR/USD Timeframe: 4-Hour (4H) Broker: OANDA Current Price: 1.08436 Trend: Potential Reversal Technical Analysis: The EUR/USD pair has been trading within a rising channel, indicating a bullish trend. However, recent price action shows a breakout to the downside, suggesting a potential bearish reversal. The price failed to sustain above resistance...
USD/JPY - Breakdown Confirmation & Potential Decline Chart Overview: The USD/JPY price action has broken down from a previously established ascending channel. A lower high formation suggests weakening bullish momentum, indicating a potential continuation of the downtrend. The key support zones are marked below, with the price likely to move towards these levels if...
Chart Overview: The 4-hour GBP/USD chart shows a strong uptrend contained within a rising channel. The price has recently reached the upper boundary of the channel and is showing signs of rejection, indicating a possible pullback. A downside move towards 1.27736 is anticipated, which aligns with a key support level. Technical Outlook: If the price respects the...
Ethereum (ETH/USD) - Potential Breakout from Range Chart Overview: The price of Ethereum (ETH/USD) has been consolidating within a range after breaking out of a long-term downtrend channel. A strong support level is identified around $1,852, which has been holding the price steady. A resistance zone near $2,076 is acting as a short-term barrier for upward...
📈 Chart Pattern: Gold has been trading inside an ascending channel, showing a strong uptrend. However, the price has started to decline from resistance, signaling a potential correction. 🔹 Key Levels: Current Price: $3,036.77 Support Target: $2,980.48 - $2,978.25 (First key support level) Stronger Support: $2,829.63 (Major trendline support) 📊 Trading...
📈 Chart Pattern: Bitcoin has been trading inside a descending channel for several weeks. Recently, BTC has broken out of the channel’s upper boundary, indicating a potential shift in momentum. 🔹 Key Levels: Support: $80,043.75 (Critical stop-loss level) Resistance: $87,500 (Short-term) Target: $92,944.17 (Upside projection) 📊 Trading Plan: BTC might retest the...
Analysis: Gold (XAU/USD) has been trading within a well-defined ascending channel on the 4-hour timeframe. The price is now approaching the key resistance zone around $3,054, where sellers may become active. A potential bearish rejection could lead to a reversal towards the $2,980 target level, aligning with previous support. The setup suggests a sell opportunity...
Chart Overview: This 4-hour chart of Gold (XAU) against the Euro (EUR) suggests a potential bearish setup as the price has reached a key resistance zone. Key Observations: Resistance Zone: The price has broken above a descending channel and is testing a significant resistance level around 2,790 - 2,800 EUR. Sell Signal: A rejection from this resistance level has...
📌 Overview: The EUR/GBP pair is showing signs of bearish continuation after failing to break above key resistance levels. Price action indicates a potential downward move towards a major support zone, aligning with the overall market structure. 🔎 Technical Analysis: The pair has formed a lower high, indicating weakness in bullish momentum. A breakdown from the...
📈 Trend Analysis: The price is trading within a rising channel, suggesting an overall bullish trend. The market recently pulled back to a key support level, presenting a potential buy opportunity. 🔍 Key Levels: Buy Zone: Around 1.08680 - 1.08966, marking strong support. Target: 1.10140, aligning with the upper trendline resistance. 📌 Trade Plan: Look for buy...


