PIPsOptimizer
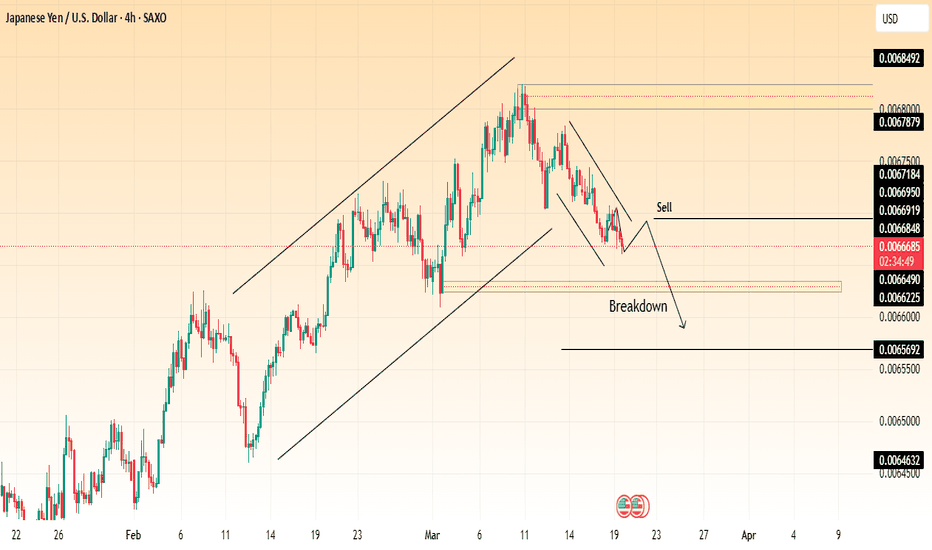
📉 Trend Analysis: The chart shows a breakdown from an ascending channel, indicating a potential bearish reversal after an extended uptrend. Price has formed a descending channel, reinforcing the short-term bearish structure. 🔍 Key Levels: Sell Zone: Around 0.0066848 - 0.0066919, acting as resistance. First Target: Around 0.006490, a strong support area. Second...
Overview: The British Pound (GBP) against the US Dollar (USD) is currently trading within an ascending channel on the 4-hour timeframe. The price is approaching a key buy zone at the lower trendline, presenting a potential long opportunity if bullish momentum continues. Key Market Structure Analysis: 🔹 Uptrend in Progress: GBP/USD has been forming higher highs...
Overview: Ethereum has been in a downtrend, forming a descending channel, but it recently found strong support at $1,764 and has now broken out of a range-bound consolidation. This could be the beginning of a bullish move towards higher resistance levels. Key Market Structure Analysis: 🔸 Previous Downtrend: ETH was trading within a bearish channel, creating...
Market Structure & Key Levels: The Bitcoin (BTC/USD) 4-hour chart displays a descending channel breakout, followed by a range-bound consolidation phase. Key Support Levels: $78,000 - $77,320: A strong demand zone where buyers have previously stepped in. $80,000: Psychological support level. Key Resistance Levels: $84,340: Short-term resistance currently being...
Chart Analysis: Current Price: $3,039.93 Resistance Level: $3,055.47 (marked as a key level where a sell opportunity is identified). Target Level: $3,000.73 (suggested as the take-profit area). Support Zone: Highlighted around $2,900. Trading Idea: The price is in an uptrend, but a potential reversal is expected at the $3,055.47 resistance level. If the price...
Bitcoin is currently trading inside a descending channel, with price consolidating in a small range. A breakout from this zone could trigger a strong bullish move toward the upper boundary of the channel. 🔹 Key Observations: BTC is trading within a well-defined downward channel. Current Consolidation: A small range has formed, suggesting a potential buildup...
Gold Spot (XAU/USD) indicates a potential continuation of the current downtrend. 🔹 Sell Limit at 3082: A significant level where a sell order was placed, marking the start of the recent decline. 🔹 Strong Downtrend: After rejecting the 3082 level, gold has been making lower highs and lower lows, confirming bearish momentum. 🔹 Support & Target Zone: Price is...
This 1-hour chart for the Bitcoin market cap ( CRYPTOCAP:BTC ) suggests a potential bullish breakout. 🔹 Major Support: The price recently tested and respected a strong support zone, indicating buyers are stepping in. 🔹 Triangle Formation: A symmetrical triangle is forming, which typically leads to a breakout. 🔹 Weak High & ATH Target: If the breakout...
Gold has been in a strong uptrend, forming a rounded bottom pattern, which led to a breakout above key resistance. Currently, price is consolidating near the all-time high (ATH) around $3,005, suggesting a potential liquidity sweep before a larger move. 📌 Key Observations: Rounded Bottom Formation: A bullish reversal pattern led to a breakout. Consolidation...
Overview Gold (XAU/USD) is showing signs of a potential bullish reversal after a recent decline. A buy limit order is placed around the $2,911 level, targeting a move towards the $2,928 resistance zone. This setup follows a structured risk-reward approach with a stop loss below recent lows at $2,900.90. Trade Setup 📍 Buy Limit: $2,911 (Key support zone) 📍 Stop...
Overview The British Pound (GBP/USD) is currently trading around 1.2652, showing a bullish recovery after sweeping weekly sell-side liquidity. Price has reacted from a weekly fair value gap (W.FVG) / BISI and is approaching key resistance levels. Key Levels & Liquidity Zones 📌 Weekly Sellside Liquidity: Taken, leading to a bullish reversal. 📌 Weekly Buy-side...
Overview: A bearish reversal setup based on Fair Value Gaps (FVGs), a concept used in Smart Money trading strategies. Key Technical Insights: 🔹 Fair Value Gap (FVG) Zones: The price is approaching an FVG entry zone around 1.2700, which may act as resistance. A second FVG zone is located around 1.2850 - 1.2900, offering a secondary entry for shorts. 🔹 ...
Overview: A potential bullish breakout from a falling wedge pattern, signaling a trend reversal. Key Technical Insights: 🔹 Falling Wedge Formation: Ethereum price has been trending downward inside a falling wedge, a common bullish reversal pattern. The price is now testing the upper wedge resistance, indicating a possible breakout. 🔹 Support & Resistance...
Overview: A potential bullish breakout from a triangle pattern, signaling a continuation of the uptrend. Key Technical Insights: 🔹 Triangle Formation Breakout Gold price has been consolidating inside a symmetrical triangle, a common pattern before a breakout. The price has just broken above the resistance, confirming a potential bullish move. 🔹 Support &...
Chart Overview: A possible bullish retracement setup. The price has recently experienced a sharp decline, but a recovery is forming, suggesting a potential buying opportunity. Key Trading Zones: 🔹 Entry Zones: 1st Entry: Around 95,790 USD, where the price is currently consolidating. 2nd Entry: Near 97,150 USD, an intermediate resistance level. 3rd Entry: Close...
Chart Overview: This 15-minute XAU/USD chart from OANDA shows a potential bullish setup with clearly defined support, resistance, and trade levels. The price is currently in an upward trend, with a possible pullback before further continuation. Key Trading Zones: 🔹 Strong Support Level: Around 2,921 - 2,930 USD, where buyers previously stepped in. 🔹 Resistance...
Gold (XAU/USD) is currently trading inside an ascending channel, showing a bullish trend. However, a key trigger line at $2,936 will determine the next move. 🔹 Bullish Scenario: If price stays above $2,936, we can expect a push toward $3,028 and potentially $3,085. A breakout above $3,085 would confirm strong bullish momentum, targeting new highs. 🔻 Bearish...
Gold is currently forming a symmetrical triangle pattern, indicating potential breakout opportunities. The price is near $2,915, trading between key support and resistance levels. Key Levels: 🔹 Resistance Zone: $2,940 - $2,950 Price has rejected this level multiple times. A breakout above this area could trigger a bullish move. 🔹 Support Trendline: $2,880 -...


