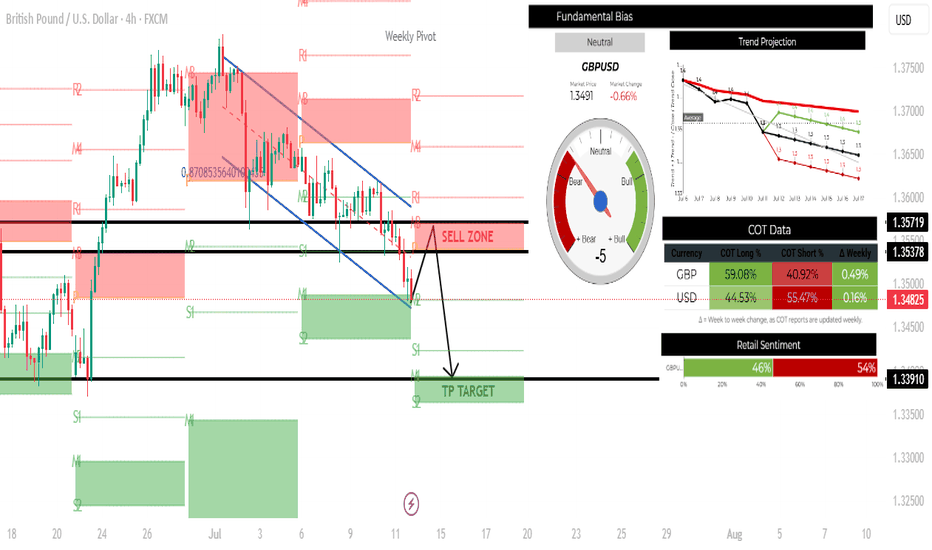
🔍 Trade Overview Bias: Bearish (Short Setup) Pair: GBP/USD Timeframe: 4H (Short-to-Mid Term Trade) Strategy: Trend Continuation (Sell the Rally) 🧠 Technical Analysis Chart Analysis (4H GBP/USD) Price is currently in a downtrend, trading within a descending channel. There’s a marked "Sell Zone" around 1.33463, which aligns with a resistance level and prior...
🔍 1. Market Overview 🔸 Technical Outlook (4H Chart) Price: Currently at 1.37792, just above a strong Buy Zone at 1.37659. Structure: Bullish trend continuation with higher highs and higher lows. Targets: TP Target: Clearly marked at 1.39310 to 1.39793 resistance zone. Support: Strong base near 1.37659; additional support at 1.35586. Bias: Bullish, based on...
📊 Trade Plan: AUD/JPY – August 2025 🧠 Summary: AUD/JPY has broken a clear ascending channel and retested the breakdown area, aligning with a marked sell zone. Institutional data supports JPY strength and AUD weakness, while trend projections suggest downside momentum into mid-August. 1. Technical Analysis (4H Chart) Channel Break: Price broke below the rising...
📊 Trade Plan: EUR/USD – August 2025 🧠 Summary: EUR/USD has recently broken a strong ascending channel, confirmed a double top, and dropped into a sell zone. Fundamentals, sentiment, and projection data align for further downside potential targeting the 1.11948 area. 1. Technical Analysis Pattern: Double Top at ~1.18 with a confirmed neckline break. Channel:...
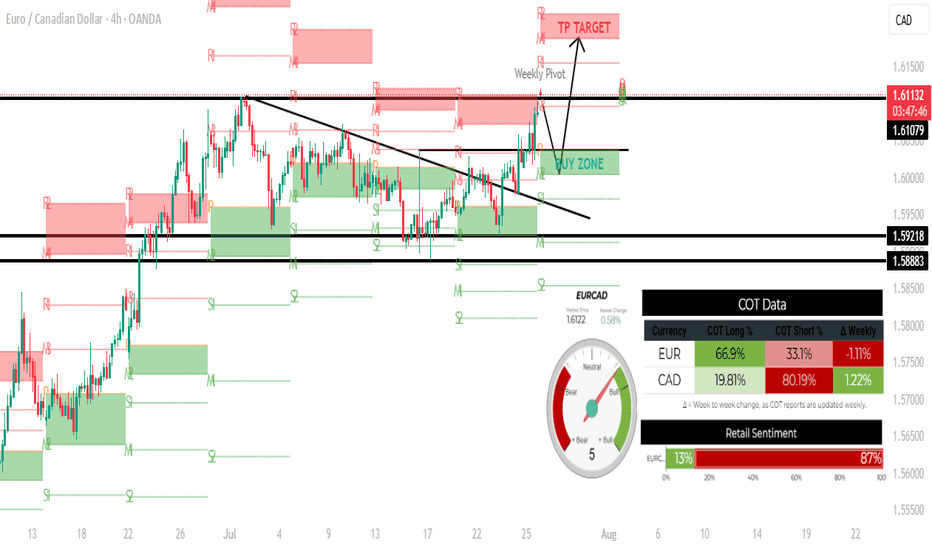
✅ EUR/CAD Trade Plan (4H Timeframe) 🔍 Bias: Bullish 🧠 Why Buy EUR/CAD? Reason Details 📊 COT Data Institutions are 66.9% long EUR and 80.19% short CAD 👥 Retail Sentiment 87% of retail traders are short (contrarian signal = bullish) 📈 Technical Setup Breakout + retest of descending trendline and resistance = bullish continuation setup 🔍 ...
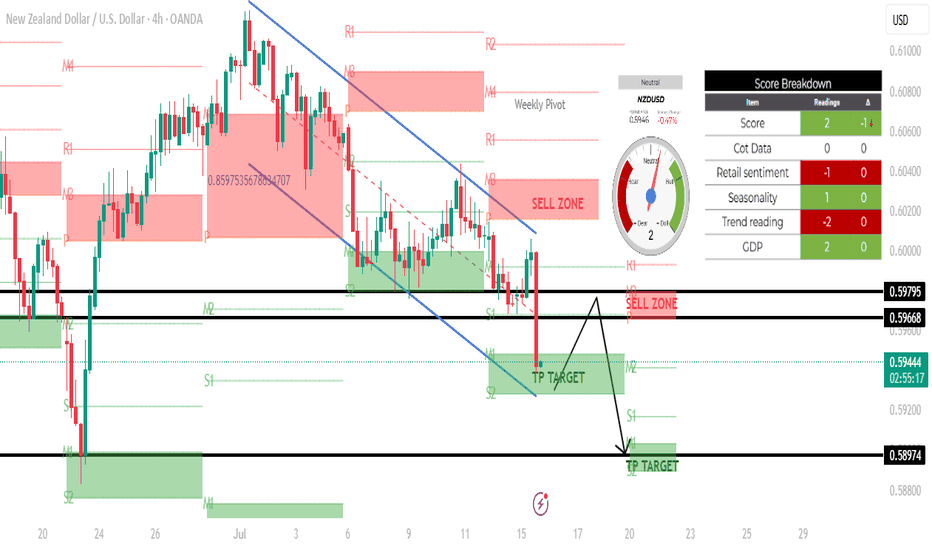
Based on the 4-hour chart of NZD/USD, here's a technical analysis of the current setup: \--- 🕒 Timeframe: 4H 💱 Pair: NZD/USD 📉 Current Price: Around 0.59430 --- 🔍 Chart Structure and Analysis: 🔻 Trend: The market is in a clear downtrend, as indicated by the descending channel and the strong bearish candle that broke below the previous support zone. Sellers...
This is a 4-hour chart of the EUR/USD currency pair, and it includes several key technical elements: --- 🔍 Overall Market Context The price is in a downtrend, clearly shown by the descending channel (highlighted with yellow lines). The price just broke below the lower boundary of that channel, indicating potential bearish continuation. The chart includes...
The 4-hour chart of XAU/USD (Gold Spot vs U.S. Dollar) presented reflects a technically structured bullish continuation setup, supported by both price action and key technical zones. Technical Overview 1. Current Price Action: Gold is trading near 3,371.335, slightly above a marked Weekly Pivot. The price has recently broken out of a descending channel (orange...
TECHNICAL ANALYSIS Market and price are both bullish. After printing a higher low bulls will be looking to push price to the upside all the way to this weeks TP target. FUNDAMENTAL ANALYSIS Fundamentals also indicate bullishness. The currency pair NZDJPY has a score of 11, indicating that the base currency is stronger than the quote currency. The seasonality...
TECHNICAL ANALYSIS This pair is bullish and its in a beautiful upward channel creating higher highs and higher lows. Price is currently in the weekly buy zone which is also the current support area. Bulls will be looking to go long here and hope to take price all the way to the projected take profit target. FUNDAMENTAL ANALYSIS The currency pair GBPJPY has a...
TECHNICAL ANALYSIS Price and market both bearish, with price currently at support. This pair will have to pull back to the resistance level before bears can look to short. FUNDAMENTAL ANALYSIS The currency pair GBPUSD has a score of -3, indicating that the base currency is weaker than the quote currency. The trend projection also shows further downside. The...
TECHNICAL ANALYSIS The pair has finally broke out of the range to the upside, a strong sign of the bullish trend continuation. As we can see price closed @ 1.7973 resistance and also forming a higher high. To go long wait for price to get to support at the buy zone and a print of a higher low. FUNDAMENTAL ANALYSIS The trend meter indicates that the market is...
TECHNICAL ANALYSIS This pair is currently in a beautiful bullish trend, and price is currently at WM4/weekly tp@170.588. I am anticipating profit-taking from traders as the trading week comes to a close. This trade plan will probably play out next week. Bulls will be looking for long setups at support @ 169.791/169.395, which is the buy zone and previous...
TECHNICAL ANALYSIS This week AUDJPY broke out of the range to the upside. The price is currently at the weekly target. Given that it's Thursday and the end of the week is approaching, a possible take profit could occur from now until the end of Friday. Support is at the previous resistance price level of 94.830, which is now the future buy zone. I will wait for...
This week AUDJPY broke out of the range to the upside. The price is currently at the weekly target. Given that it's Thursday and the end of the week is approaching, a possible take profit could occur from now until the end of Friday. Support is at the previous resistance price level of 94.830, which is now the future buy zone. I will wait for the price to drop to...
Price has made it to the downside, so we expect a lower high print before the next sell
Price is heading to the upside after bouncing off support. Bulls will look to push price higher and possibly try to break resistance to the upside.
Price on this chart has been trapped in range trading between 1.8160 which is resistance and 1.7765 acting as support. Price has been rejected at this support level twice indicating that this could possibly be a strong support area. Seeing that price is at the bottom of the range, a bull has the opportunity to buy at support and take price all the way to the top...


