ProR35
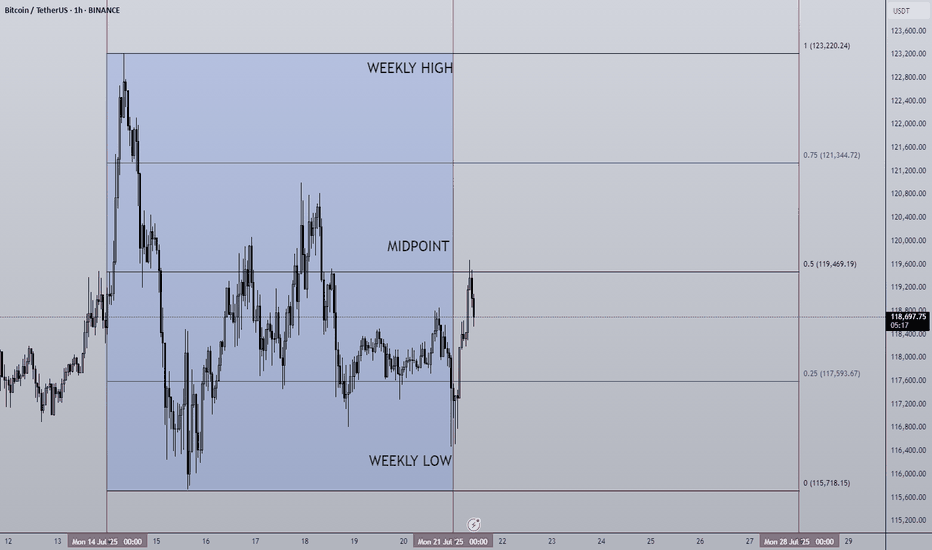
EssentialLast weeks high: $123,220.24 Last weeks low: $115,718.15 Midpoint: $119,469.19 New BTC ($123,220) & SPX ($6,315) ATH last week! We're really seeing progress being made on all fronts now, bitcoin saw its sixth week of net inflows into BTC ETFs ($2.39B). The week began strong hitting the new ATH very early and then settled into a tight range to cool off....
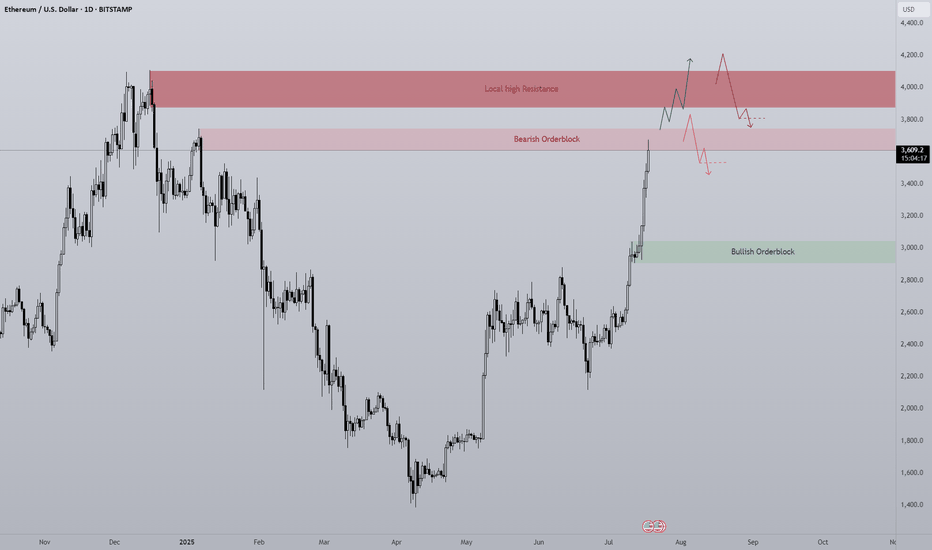
Finally we are seeing altcoins regaining lost ground on Bitcoin and the second largest crypto by market cap is rallying strong. Since ETH has such strength currently the opportunity to short is quite slim with high risk, however I think it's important to see where ETH may find some resistance or if a pullback was to happen, where would it come from? The first...
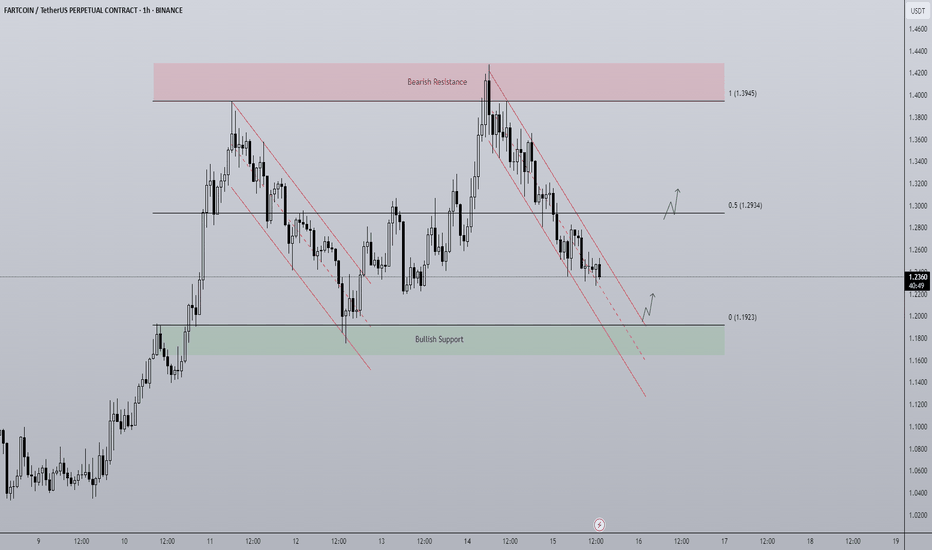
A BTC makes new highs attention has turned towards altcoins to play catch up. FARTCOIN has been a top performer of the last month and currently on the 1D timeframe finds itself in a rangebound environment capped between $1.1923 - $1.3945. The end of last week price trended down in a bearish channel from top to bottom and it looks to be doing the same currently....
Last weeks high: $119,494.32 Last weeks low: $107,467.52 Midpoint: $113,480.92 NEW BTC ATH! This is what we've all been waiting for, BTC breaks through resistance at $110,000-112,000 to set a the highest weekly close ever ($119,086). Thanks to a further $2.27B net inflows via BTC ETFs, the passing of the "big beautiful bill" flipping from a more deficit...
As Q2 closes, Q3 begins... The 2nd quarter of 2025 made up for a lot of the losses of Q1 peaking at $3.5T in the middle of the quarter. Since the peak a steady downtrend channel has formed and continues to be the case going into Q3. What can we expect to see in the next 3 months in the crypto market? For me there are two different scenarios that are bullish,...
Last weeks high: $110,529.95 Last weeks low: $105,108.81 Midpoint: $107,819.38 The "Big Beautiful Bill" was signed into law last week on the 4th July, a huge event in the financial world and undoubtedly the world of crypto. The debt ceiling is now instantly raised by $5T making risk-on assets even more appealing than ever, incoming demand shock will likely help...
Last weeks high: $108,531.02 Last weeks low: $99,592.69 Midpoint: $104,061.86 Overall a positive week for BTC in isolation as price moves steadily all week reclaiming the losses made in the week from the 16th-23rd June. This comes after a $2.2B BTC ETF weekly inflow, the 3rd consecutive week of net inflows. Having now hit the key S/R level of $108,500 it will...
Last weeks high: $108,948.76 Last weeks low: $103,569.91 Midpoint: $98,191.05 Last weeks chart is a clear reflection of what happens when there is a constant stream of bad news... Geo-political escalations, America becoming more involved in the Middle-east and the FED refusing to cut interest rates. It's well known markets do not like uncertainty, and...
Altcoins have certainly taken a backseat to BTC this cycle with Bitcoin dominance holding around 65%. Despite this, there are still some good setups in altcoins presenting themselves each day, one of which is TAO on the 4H. To me it looks to be in a clear downtrend respecting the upper and lower limits while reacting off of support levels on the way down. As it...
On the hourly time frame it is clear that BTC is within a rangebound environment. Using key levels such as the weekly highs and lows with Mondays highs and lows to to paint a picture of where support and resistance may be. In the "weekly outlook" post for this week I suggested a retest of the $108,500 area, an orderblock that pushed prices lower and is notorious...
Last weeks high: $110,507.76 Last weeks low: $102,655.69 Midpoint: $106,581.52 With all eyes on the ever escalating geo-political landscape, how did BTC react and what can we see for this week? The initial move higher broke through the previous weeks high with strength before a triple top just under ATH, then falling back down towards the lows of $102,650...
After Bitcoin makes new all time highs, the next steps are very important. Where price goes now can be tricky to predict as there is the rare factor of price. One of the only ways to predict where BTC may find resistance during price discovery is to use Fibonacci levels, using Fib extensions the first target for me would be between $117,500-$120,000. This area...
Last weeks high: $106,812.33 Last weeks low: $100,372.93 Midpoint: $103,592.63 Billionaire spats and V-shaped recoveries, the beginning of June starts off in an interesting way. As President Trump goes forward with "The big beautiful bill" Elon Musk lets his feelings be known publicly sending shockwaves throughout markets, but what does this mean for...
Last weeks high: $110,718.68 Last weeks low: $103,065.74 Midpoint: $106,892.21 As we approach the middle of the year, Bitcoin is back above $100,000 despite pulling back from a new ATH of $112,000. In the month of MAY BlackRocks ETF had record inflows of over $6B propelling prices 11% higher. Last week we saw as the month closed and with that it's natural to...
Last weeks high: $111,965.73 Last weeks low: $101,994.78 Midpoint: $106,980.26 New BTC ATHs! Well done to those who capitalized on the move and continue to believe in this Bitcoin. For the last two weekly outlooks I have talked about the pattern of consolidation for 1 week --> expansion the next. Last week We got our expansion week right on queue and this time...
The daily chart in its simplest form can be broken down into this range. Since President Trumps inauguration, BTC has declined from a range high of $108,000 back to the lows of $74,500 closing the FVG caused by the US election rally. After a double bottom Bitcoin mean reverted back to the range midpoint which to me is the most important area on the entire chart...
Last weeks high: $105,46 Last weeks low: $100,751.75 Midpoint: $103,372.10 In my weekly outlook post from last week I mentioned how there was a clear pattern of consolidation with a tight range for a week with a week of expansion that followed, and that if the pattern were to continue we would see BTC consolidate around the weekly high. The theory was proven...
One of the most important crypto projects is undoubtedly Chainlink. Having been in a downtrend like must altcoins ever since President Trumps inauguration , LINK looks to finally be ready to exit the bearish trend channel for the first time this calendar year using the newly flipped 1D 200 EMA as a launchpad or is this a local top and the trend continues? For the...


