ProfessorSingapore
PremiumBTCUSD CONSOLIDATES BELOW RESISTANCE OF 120,000.00 Today the price rebounded from the SMA50 on 4-h chart and continues to consolidate below the resistance level of 120,000.00. Yesterday there was a minor pullback from this level, still the price is pretty much at the same levels as yesterday. The recommendation is still the same: would be safer for long trade to...
XAUUSD DEVELOPS MID-TERM BEARISH IMPULSE Yesterday was the 4th bearish day in a row for gold. The reasons are the same as for the EURUSD: American-European trade agreement. Geopolitical risks got eliminated and market participants get rid of the bullion. "If more ‘trade deals’ are reached, this could help to reduce this source of policy uncertainty that has...
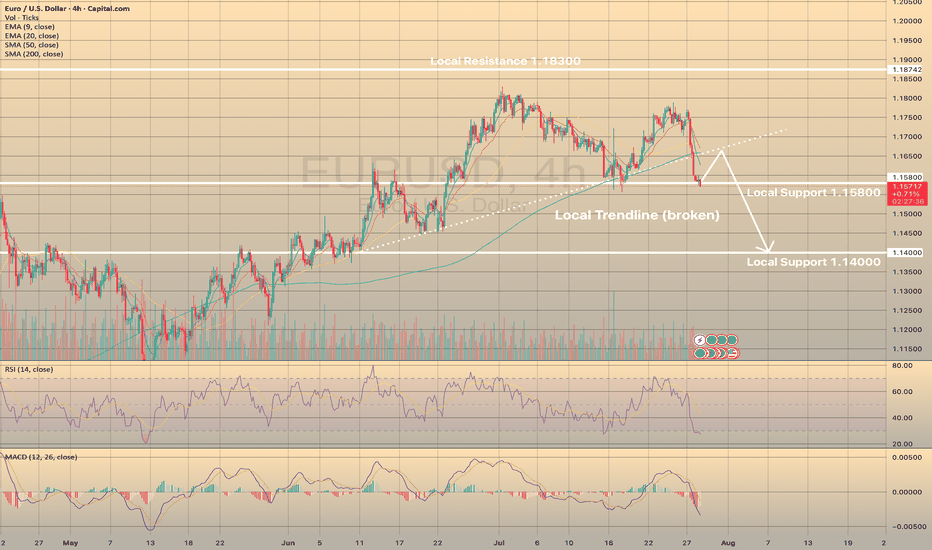
EURUSD - STRONGEST DECLINE FOR THE LAST COUPLE OF MONTHS EURUSD has lost 1.32% yesterday on the U.S. - E.U. trade deal. Experts suggest that the relief felt by the United States and the European Union upon reaching a trade agreement has been overshadowed by worries about the potential economic harm caused by a 15% tariff on EU imports. The dollar has recently...
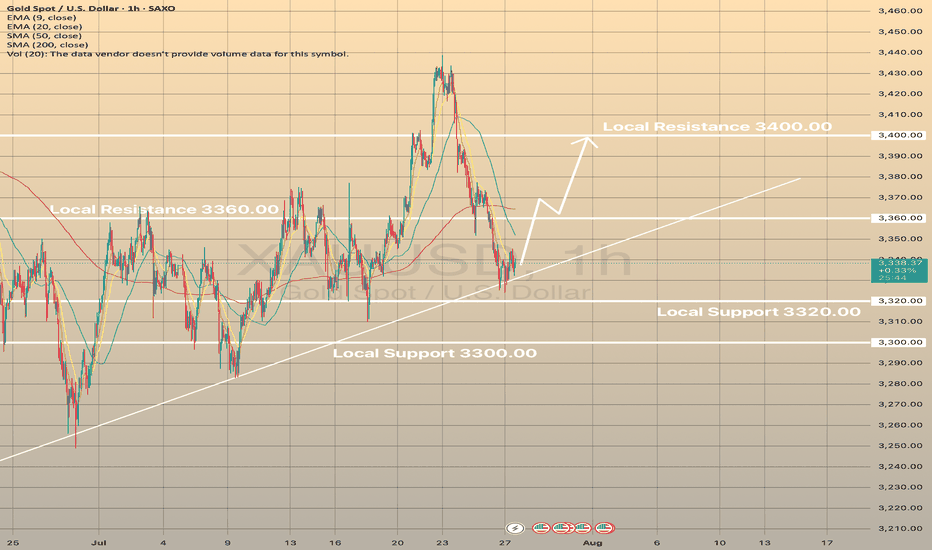
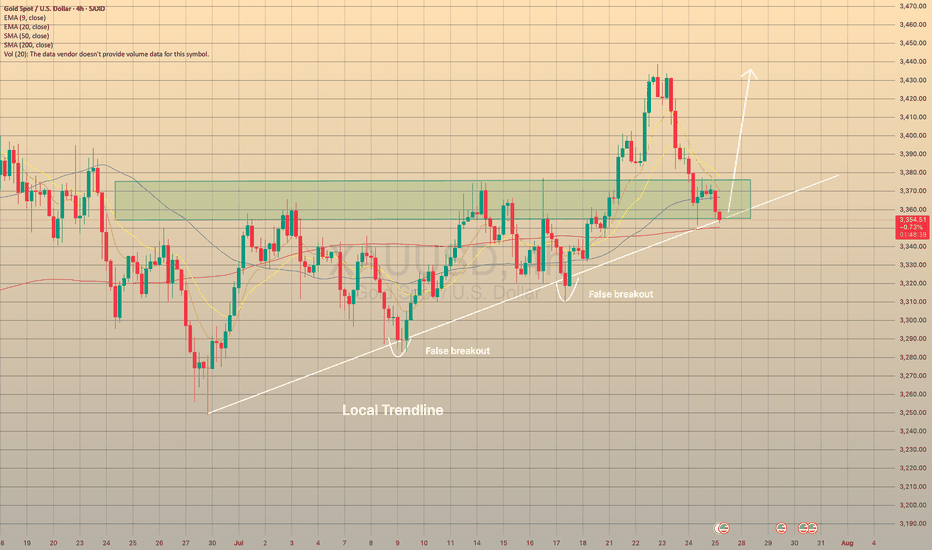
XAUUSD REBOUNDED FROM CURRENT TRENDLINE. WHAT'S NEXT? Gold had successfully rebounded from the trendline, still showing mid-term bullish trend despite recent news on U.S. - E.U. and U.S. - Japan trade deals. Currently price is attempting to hold above the EMA20 on 1-h chart timeframe. If this occurs and the asset develops another short-term bullish impulse, we...
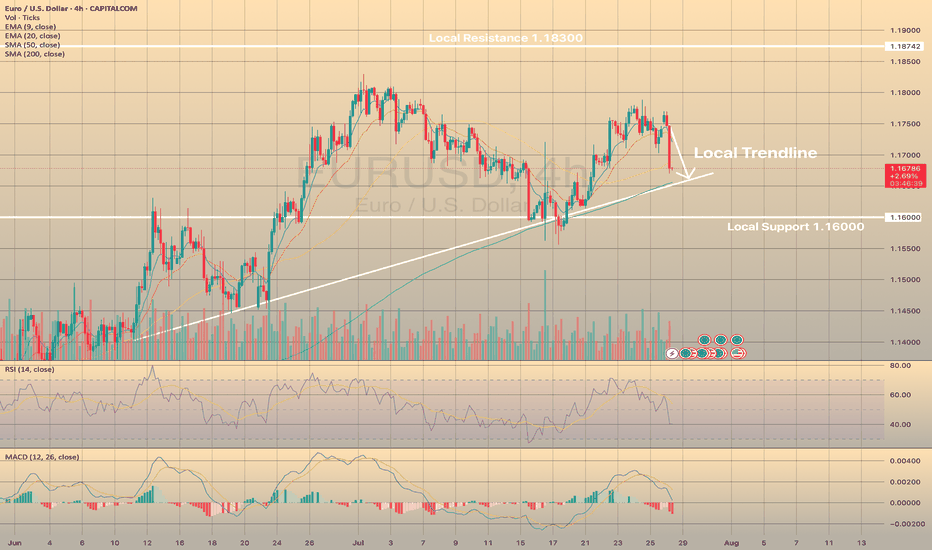
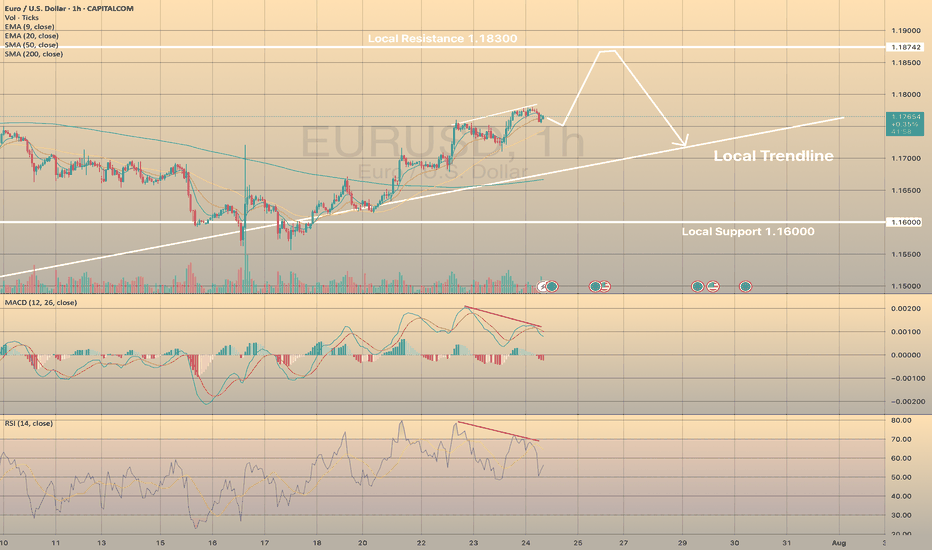
EURUSD LOSSES BULLISH MOMENTUM. WHERE TO GO? The asset didn't reach the local resistance of 1.18300 and started to consolidate before reaching this level. RSI shows weakness of the impulse on 4-h chart, as well as MACD is in the red zone. Therefore, we expect the price to slowly decline towards local trendline, where SMA200 is situated.
BTCUSD IS READY TO BREAK THE DESCENDING CHANNEL In our latest report we wrote down that the asset may rebound from lower border of the descending channel and head toward local resistance level of 120,000.00. The forecast has successfully worked out, so what's next? Currently the price consolidates slightly below the upper border of the descending channel and...
ETHUSD HEADS TOWARDS WEEKLY RESISTANCE ETHUSD has broken local resistance of 3,850.00 and is currently heading towards weekly resistance of 4,100.00, the level, established in 2021. Last time the asset came close to this level at the end of last year and reversed from it afterwards. Same situation is expected here. Price may retest the level of 3,850.00 and...
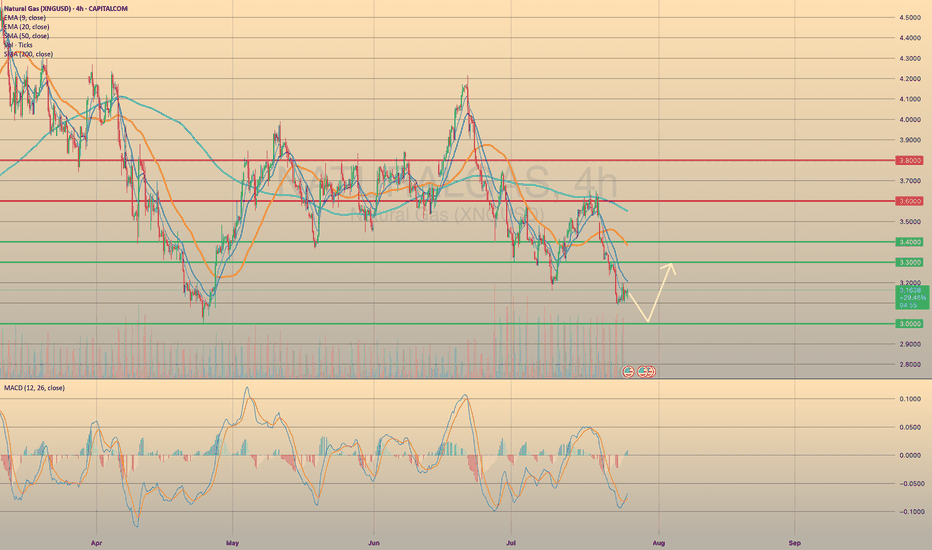
XNGUSD CONTINUES ITS DOWNWARD TREND. FOR HOW LONG? Recent bearish impulse started at the beginning of this week may come to an end soon. Yesterday the U.S. Natural Gas Storage report came out. Numbers appeared to be lower than expected and lower than previous. (23b vs 28b vs 46b). This is bullish signal for the market participants. Minutes after the report came...
XAUUSD REACHED THE LOCAL TRENDLINE On July 24 the U.S. Manufacturing PMI report came out way below forecasted (49.5 actual vs 52.6 forecasted). A number below 50 causes concerns among investors and could be a sign of an overall economic slowdown or recession. So, as a result, it could lead to an increase in demand for safe assets like gold. However, today the...
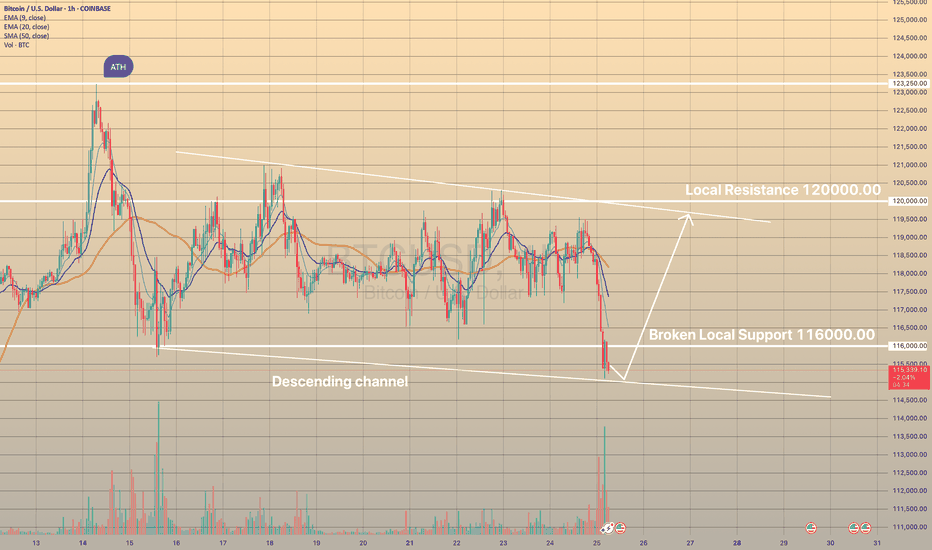
BTCUSD DROPPED BELOW LOCAL SUPPORT📉 Today bitcoin dropped below the level of 116,000.00 on high volume. However, the price didn't go somewhere far downwards and consolidates slightly below this level. Presumably, descending channel may be formed. What is a descending channel? A descending channel is a bearish chart pattern formed by two downward-sloping...
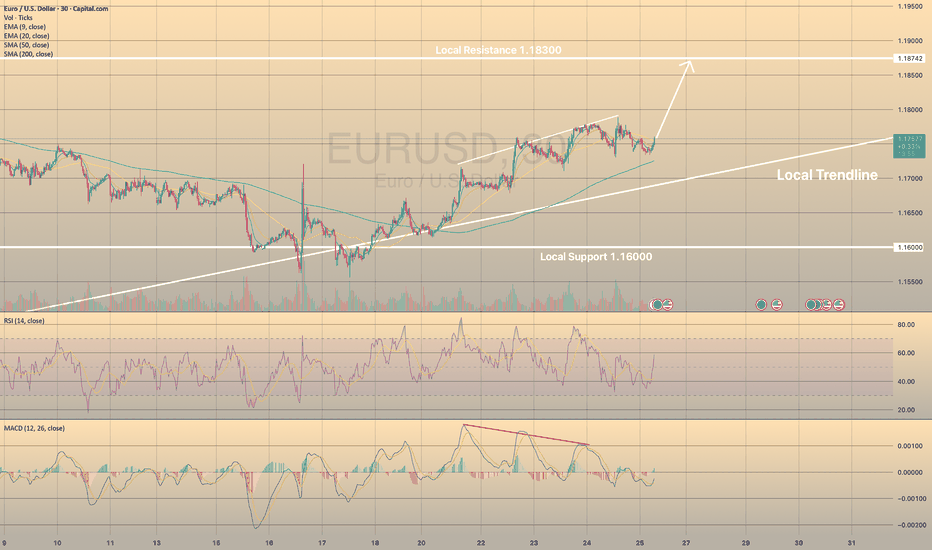
EURUSD HOLDS BULLISH MOMENTUM📈 24 July I wrote about bearish divergence in EURUSD. Now we see that this resulted into decline towards sma200 on 30-m chart. Currently the price is rebounding from this moving average. What is the sma200? The sma200 is a technical indicator that calculates the average closing price of a forex pair or crypto over the past 200...
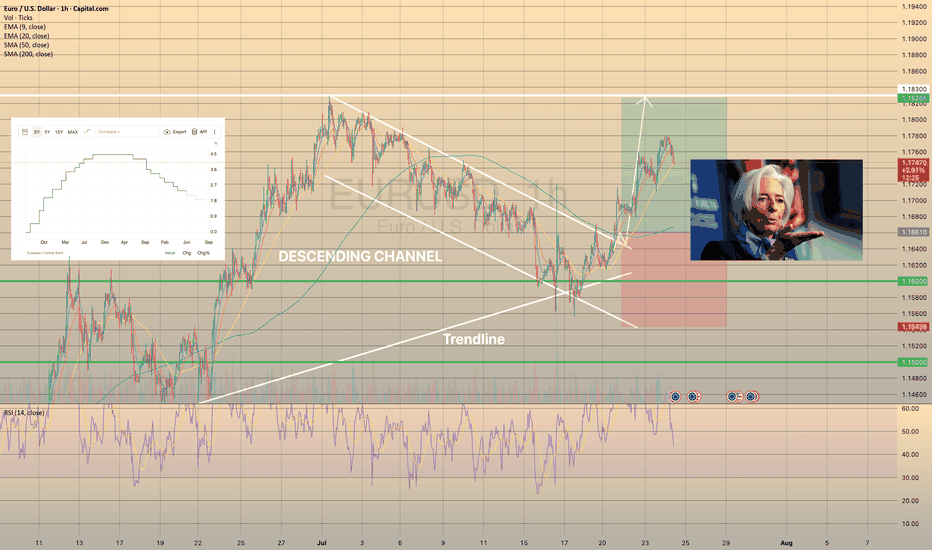
📊 ECB Interest Rate Decision: What to Expect and How EURUSD Could React This week’s spotlight is on the European Central Bank (ECB) Interest Rate Decision — a key market driver that could shape the near-term direction of the euro and broader European markets. Here's what to expect. 👇 🔔 Key Event to Watch 📅 ECB Interest Rate Decision 🕐 Date: July 24 ⏰ Time: 12:15...
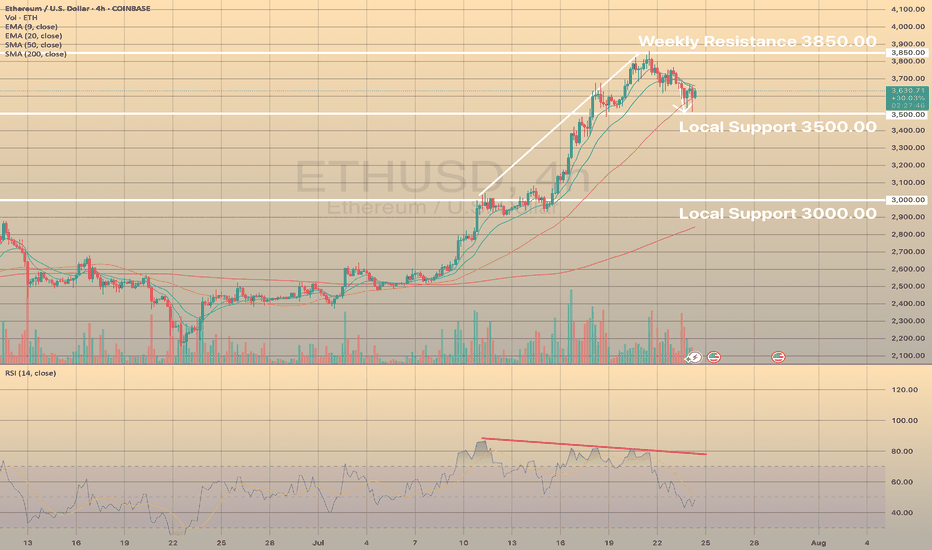
ETHUSD, XRPUSD - BEARISH DIVERGENCE SUCCESSFULLY WORKED OUT On these 2 graphs you may observe ethereum and ripple declining after strong bearish divergence showed up on both of these instruments. Here, the bearish divergence proved to be a success. In both cases the price has almost reached first targets: 3,500.00 for ETHUSD and 3.00000 for XRPUSD. What...
EURUSD IS ON ITS WAY TO LOCAL HIGHS EURUSD successfully rebounded from local support of 1.16000 and since then continues to rise towards local resistance of 1.18300. Recently the price has started to show the bearish divergence on RSI and Macd indicators. MACD went into the red zone. What is the bearish divergence? Bearish divergence is a technical analysis...
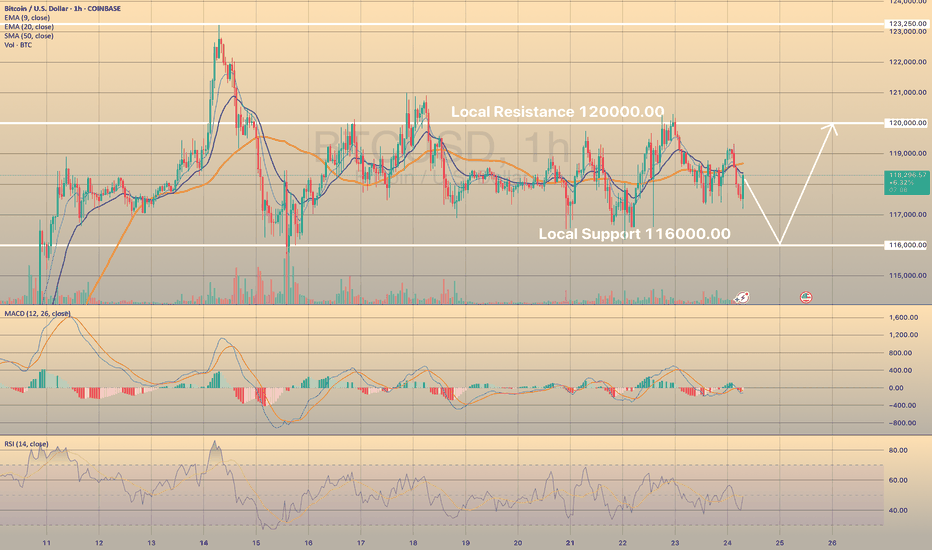
BTCUSD LOST SHORT-TERM BULLISH POTENTIAL Bitcoin has been trading sideways since July 15th within a range of 116,000.00-120,000.00. Indicators show no signs of a new bullish/bearish trend. How to trade sideways movements or range? It is better to wait for a price to come close to one of the levels (support or resistance), then open buy/sell order. Or just pace...
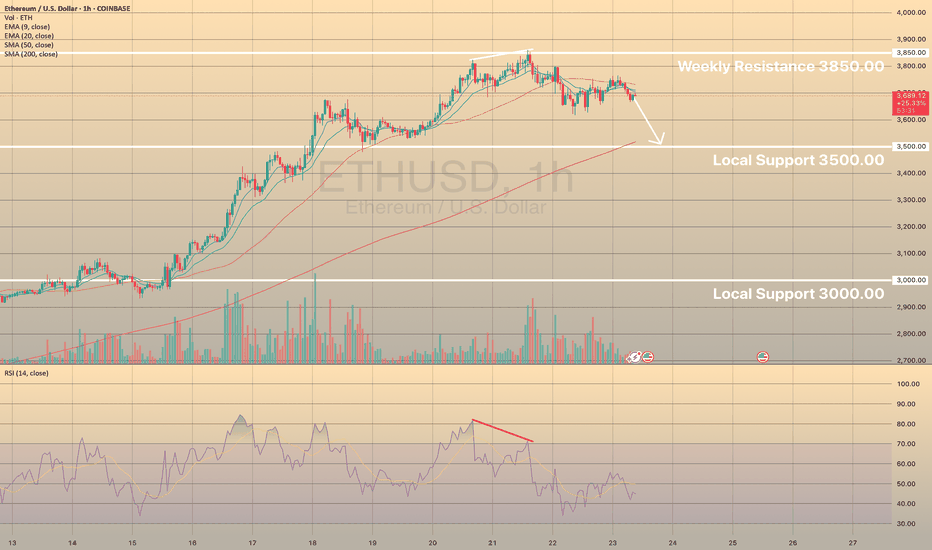
ETHUSD SEEMS TO RETEST SUPPORT LEVEL OF 3,500.00 The ETHUSD has hit some resistance at around 3,850.00 this week. But it's since pulled back from that level, which might be a sign of a cooling trend. That's backed up by the RSI going bearish. Right now, the price is below the 50 SMA on the 1-hour chart, indicating a mid-term downtrend. We could see the price...
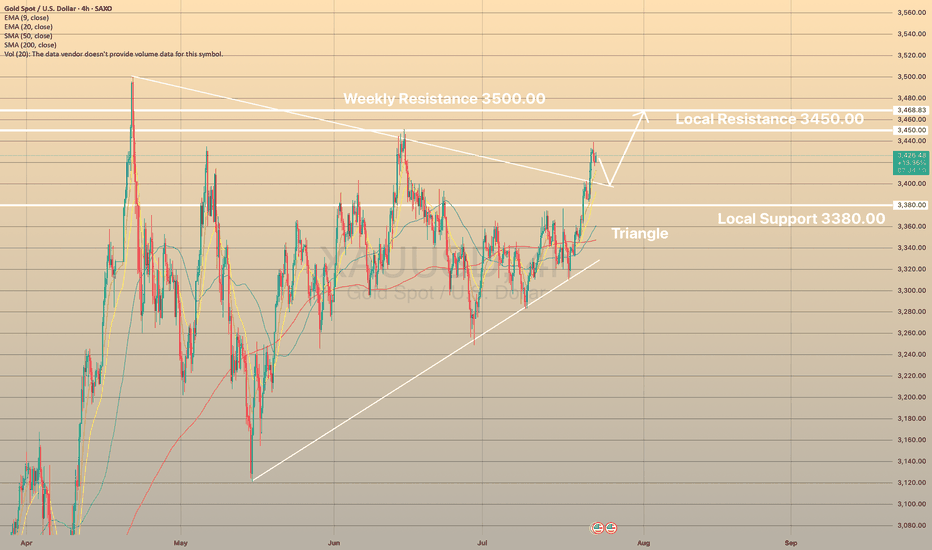
XAUUSD SEEMS TO ESTABLISH NEW BULLISH IMPULSE The recovery of the gold market appears to have gained momentum in recent days. This has resulted in the precious metal surpassing what appears to be a triangular pattern. What is a triangle pattern? A triangle pattern is a chart pattern with converging trendlines, signaling consolidation before a breakout. Types:...
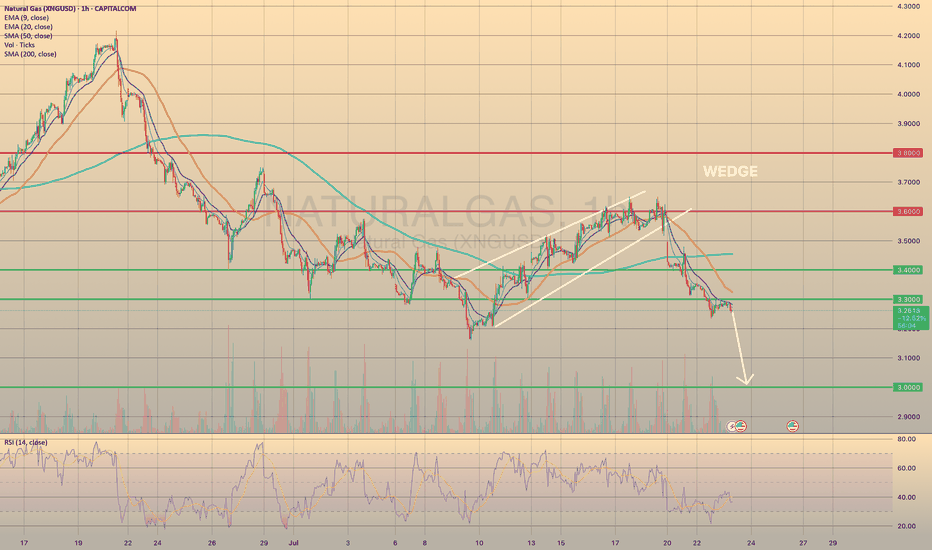
XNGUSD PULLED BACK FROM 3.3000 RESISTANCE LEVEL. WHERE TO GO NEXT? This Monday natural gas prices have successfully broken down bearish wedge formation. As we may observe, the price went down through all major support levels, establishing a new short-term bearish trend. Recently the price broke through the 3.3000 and successfully retested it. It is crucial, due...


