QuantAi-Trend
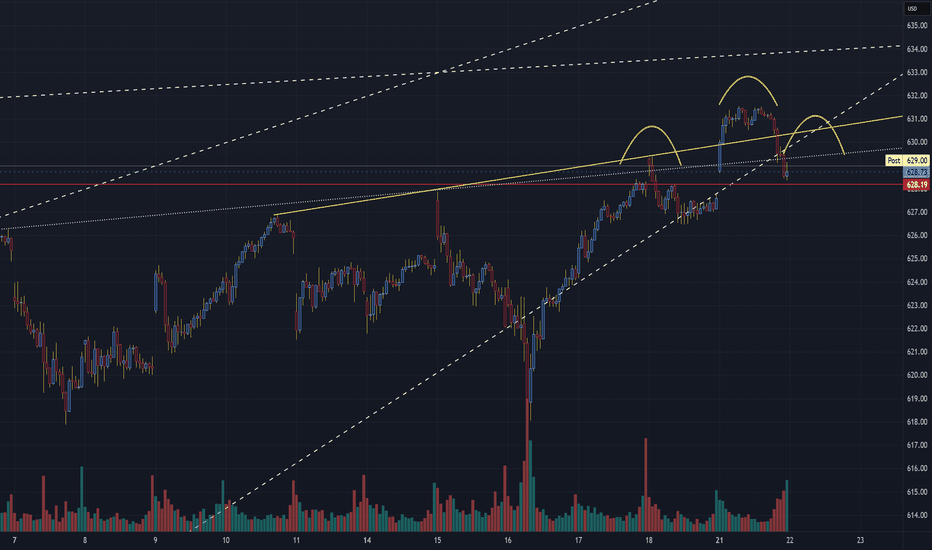
PremiumSPX Technical Update – Bearish Watch Chart Focus: S&P 500 Index (30-Min Chart) Date: July 21, 2025 🧠 Pattern Watch: Classic Head & Shoulders Formation A clear head and shoulders pattern has emerged on the short-term 30-minute chart, signaling a potential bearish reversal after the recent uptrend. Left Shoulder: Around 630.75 Head: Peaked near 633.00 Right...
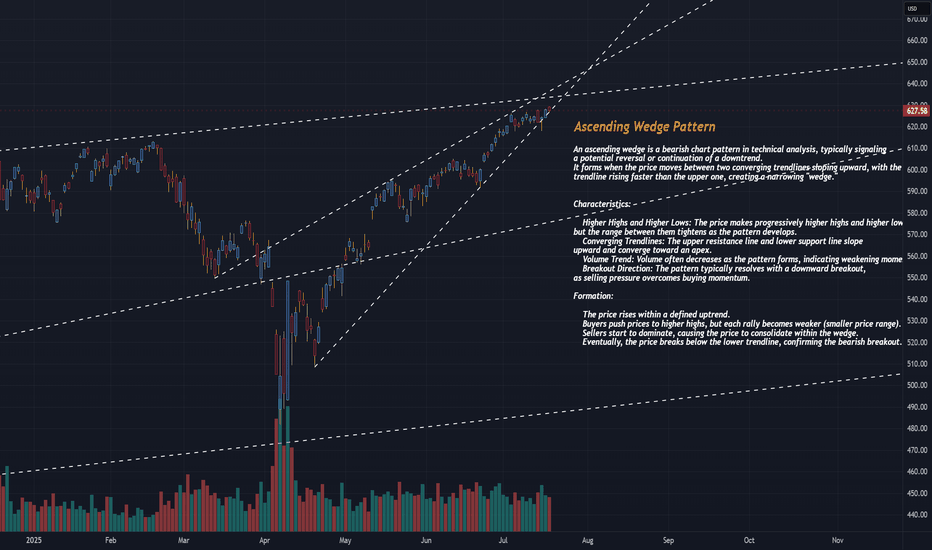
The SPDR S&P 500 ETF Trust (SPY) is currently exhibiting an ascending wedge pattern on the 30-minute chart, a bearish technical pattern that often signals a potential reversal or selloff when confirmed. Below, I’ll explain the ascending wedge pattern, identify key levels to watch for a potential selloff, and provide context based on recent market sentiment. Since...
🧠 PLTR WEEKLY TECH+FUNDAMENTAL BRIEF Ticker: NASDAQ:PLTR | Sector: AI / Big Data / Defense Tech Date: July 27, 2025 🔍 Chart Watch: Rising Wedge Risk Palantir is trading within a rising wedge formation, a pattern often signaling bearish reversal if upward momentum fades. Recent price action has tightened within this channel, and volume has been declining—a...
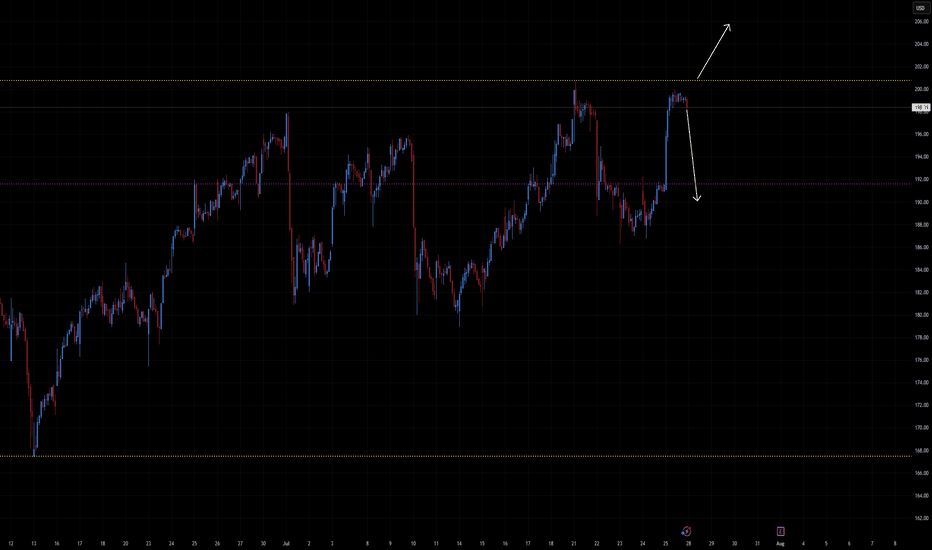
📰 Cloudflare (NET) — Technical Overview & Breakout Strategy Ticker: NET | Sector: Cybersecurity / Edge Computing Date: July 26, 2025 Current Price: ~$198 ⚠️ Context: Past Red‑Candle Sell-Offs NET has experienced sharp downward reversals often signaled by large bearish engulfing candles, especially during pullbacks from the $200–$205 range. These sell-offs...
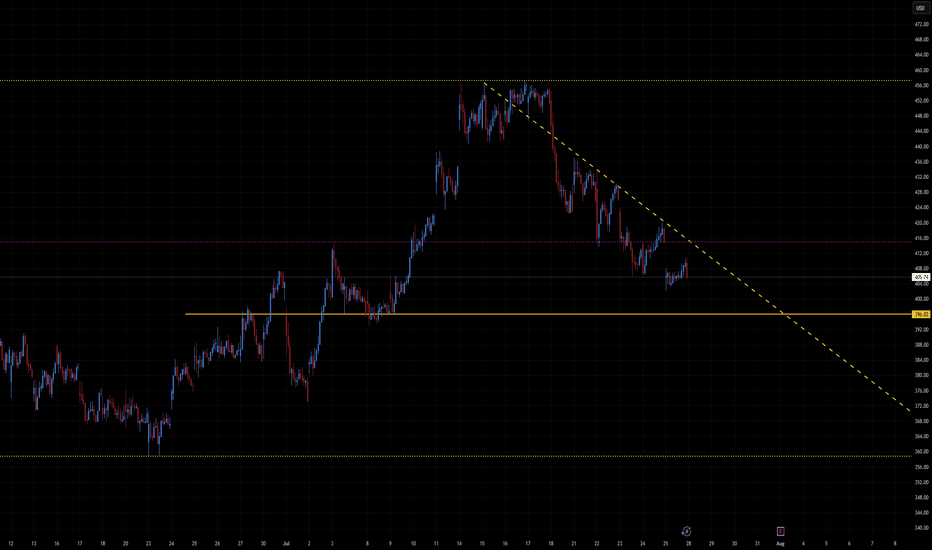
📊 MSTR – MicroStrategy Technical & Bitcoin Correlation Ticker: MSTR | Sector: Bitcoin Treasury Proxy / Enterprise Software Date: July 26, 2025 Current MSTR Price: ~$405.89 Current Bitcoin Price: ~$118,127 🔍 Chart & Price Structure Recent Action: MSTR declined from the ~$430–450 range and has consolidated around the $405 level, forming a tight base. Support Zone:...
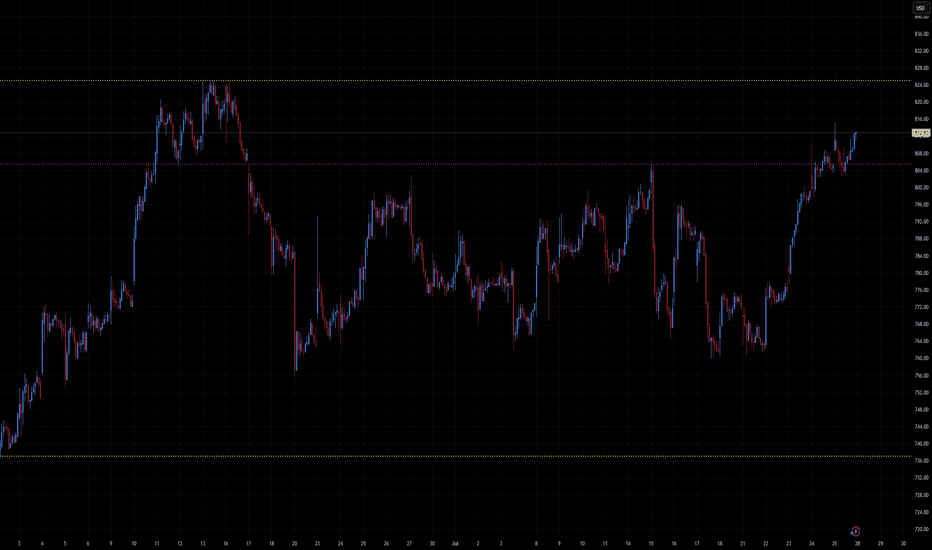
📈 LLY — Eli Lilly & Co. Ticker: LLY | Sector: Biotech / Pharmaceuticals Date: July 26, 2025 Current Price: ~$813 Resistance Zone: $825 Support Zone: $740–$750 🧪 Recent Drug News 1. EMA Backs Alzheimer’s Drug Donanemab (Kisunla) The European Medicines Agency’s advisory committee has issued a positive opinion on donanemab for early Alzheimer's patients with...
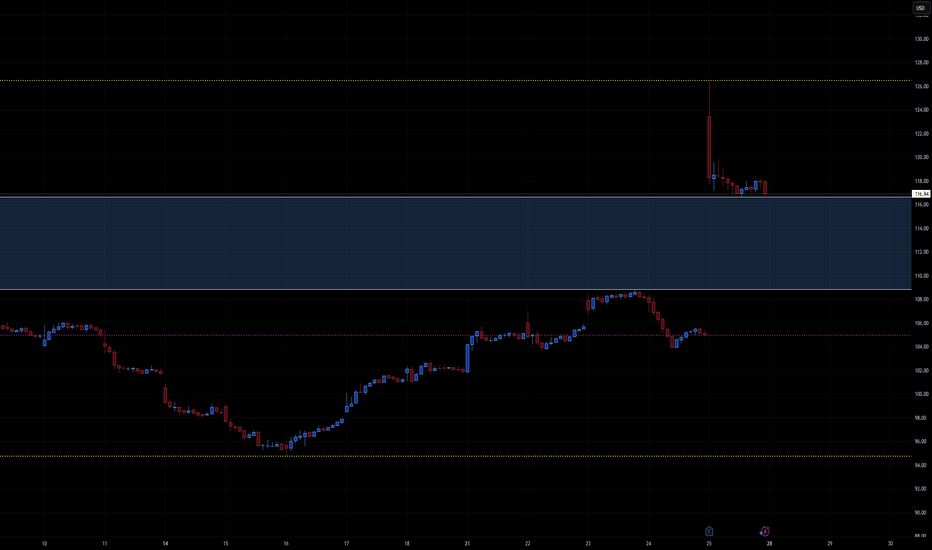
📰 Deckers Outdoor (DECK) — Technical & Macro Update Ticker: DECK | Chart Timeframe: 30‑minute | Current Price: ~$117 Sector: Footwear & Apparel Date: July 26, 2025 ⚡ Market Recap Deckers made waves this week with a strong mix of earnings momentum and analyst reactions: 👟 Blowout Q1 Earnings: Revenue came in at $965M, up ~17% year-over-year. Hoka grew 20% and UGG...
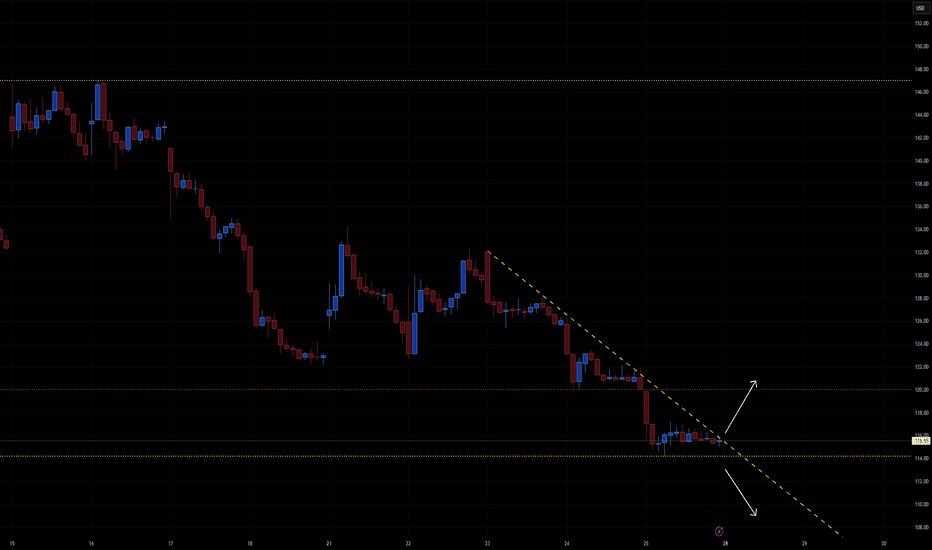
📰 CoreWeave (CRWV) — Technical & Macro Update Ticker: CRWV | Chart Timeframe: 30-min | Current Price: $115.62 Sector: AI Infrastructure / Data Centers Date: July 26, 2025 ⚡ Market Recap CoreWeave was in the spotlight this week following two key developments: 🏗️ $7 Billion Lease Deal: Entered two 15-year AI data center agreements with Applied Digital (APLD),...
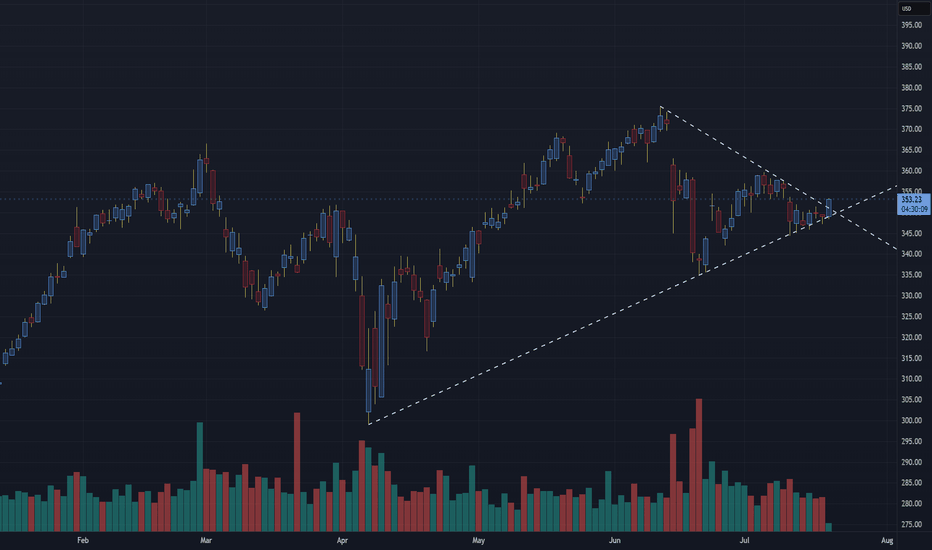
Technical Analysis: Visa Inc. (V) – Thesis: V will integrate cryptocurrency in the near future. The chart shows a symmetrical triangle pattern forming on Visa Inc. (V), which is a consolidation pattern often leading to a breakout in the direction of the prevailing trend — which in this case, has been bullish since the April lows. Bullish Case Breakout...
VNA (Carvana Co.) shows a strong bullish trend with a breakout setup forming. Here’s a detailed technical analysis: 📈 Trend Analysis: Strong Uptrend CVNA has been in a clear uptrend, characterized by higher highs and higher lows since March. The ascending yellow trendline confirms consistent buying interest with each pullback being bought. This trendline is...
Cameco Corp. (CCJ) shows a strong uptrend with a consolidation just below resistance, which is a bullish technical pattern. Let’s break it down: 🔍 Technical Analysis of CCJ 1. Trend Structure Clear uptrend: The stock has been making a series of higher highs and higher lows since March. Ascending trendline (yellow dashed line): Price continues to respect this...
🔍 Chart Structure & Key Levels Horizontal Resistance: The stock is repeatedly testing the $147.75 level, which is acting as a horizontal resistance (shown in orange). Price has stalled here for several sessions, creating a tight range just below resistance—a common precursor to breakouts. Ascending Trendline Support: A long-term upward trendline (dashed yellow)...
AAPL clearly shows a descending channel pattern, marked by two parallel downward-sloping yellow trendlines. Within that broader structure, the price is currently consolidating in a narrow range between two horizontal yellow lines: Resistance around $210.98 Support around $207.46 🔍 Current Technical Setup Consolidation Range AAPL is moving sideways in a tight...
AlphaTrend is an advanced trading indicator that leverages proprietary tools, real-time data, and custom metrics to give traders a competitive edge. Designed for all experience levels, it works instantly—no advanced charting skills required. ADVANCED and PRO versions are available. (See below) 🔍 How It Works At the core of AlphaTrend is Dynamic Reversion Bands —...
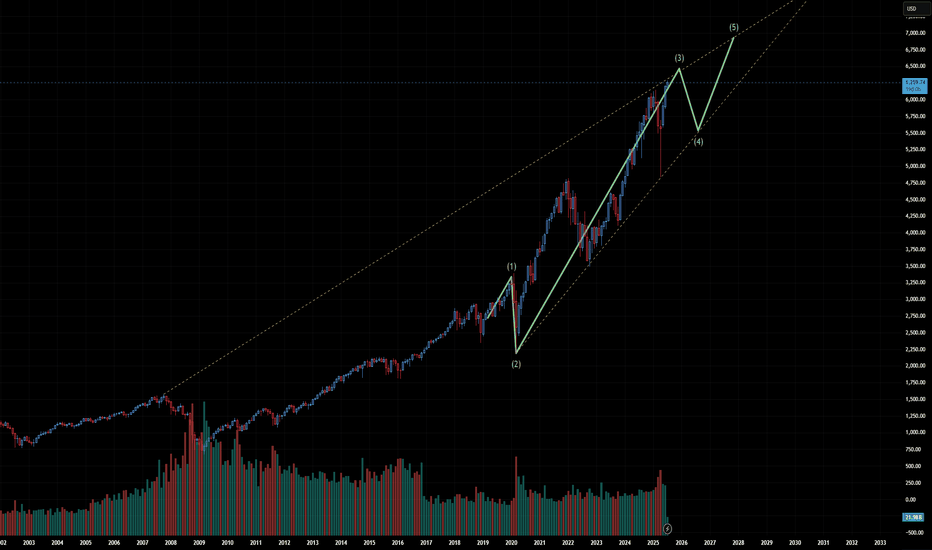
The WAVE 3 extension can go further but it seems likely that coinciding with earnings this month we will have the potential for the start of WAVE 4 retracement. The possible resignation of Jerome Powell could further intensify the charts. AlphaTrend is an advanced trading indicator that leverages proprietary tools, real-time data, and custom metrics to give...
