RSI_Trading_point
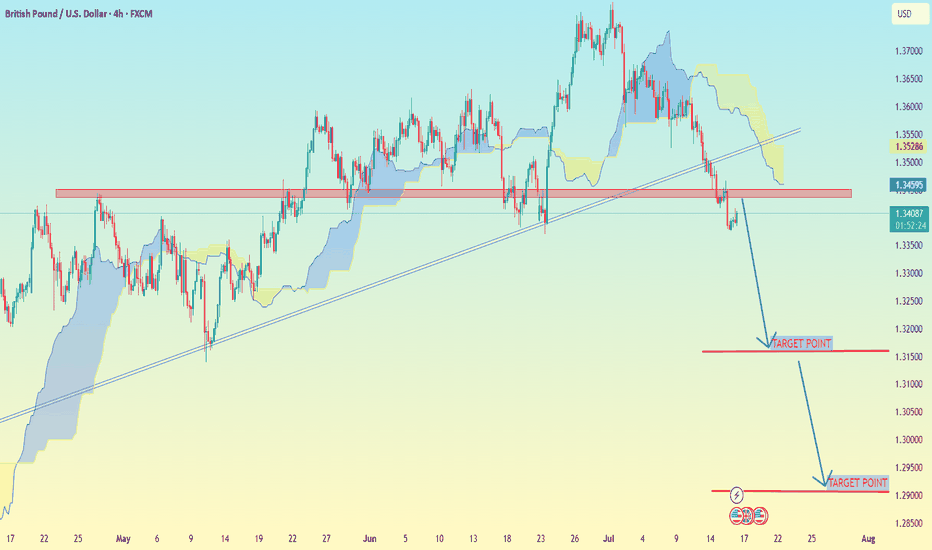
PremiumGBP/USD (4H time frame) --- 📉 GBP/USD Trade Setup – 4H Analysis Price has broken below a key trendline and horizontal support zone. Current structure shows bearish momentum with clean downside targets. --- 🔻 Sell Opportunity Entry: 1.34000 (below broken support retest) Target 1: 1.32000 Target 2: 1.29000 Stop Loss: 1.35200 (above resistance zone and...
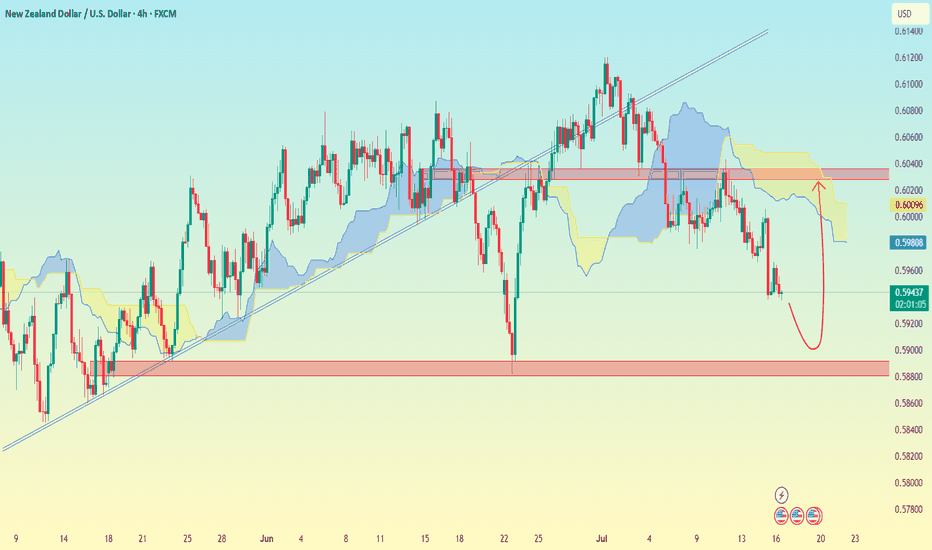
NZD/USD (4H time frame), here's the analysis: --- 📉 Chart Analysis Summary: Price has broken below the trendline and is currently below the Ichimoku cloud, indicating bearish momentum. A bearish move is likely continuing toward a strong support zone. A rebound is drawn on my analysis suggesting a possible bounce after reaching a key demand zone. --- 🎯...
USD/JPY (2H time frame), here is a breakdown: 📊 Technical Analysis Summary: The chart shows an uptrend with price respecting a trendline. Price is currently above the Ichimoku cloud, indicating bullish momentum. A pullback zone (marked in red) is shown, likely suggesting a buying opportunity. The chart indicates a projected move to the "Target Point" marked...
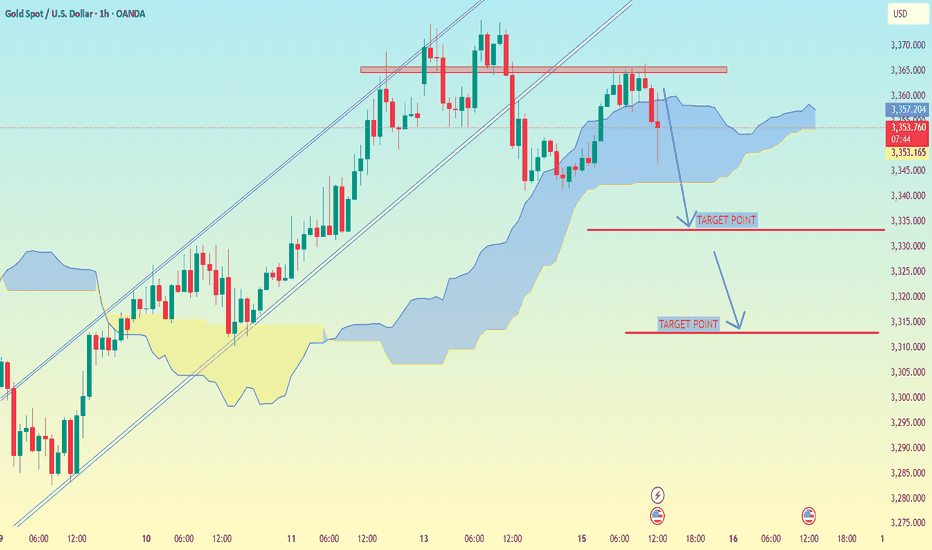
XAU/USD (Gold vs USD) on the 1-hour timeframe, the setup clearly shows a bearish breakdown from an ascending channel, supported by Ichimoku Cloud analysis. --- 📉 Target Points (as marked on your chart): 1. First Target Point: Around $2,335 2. Second Target Point: Around $2,312 --- 🔍 Analysis Breakdown: Price has broken below the Ichimoku cloud – a...
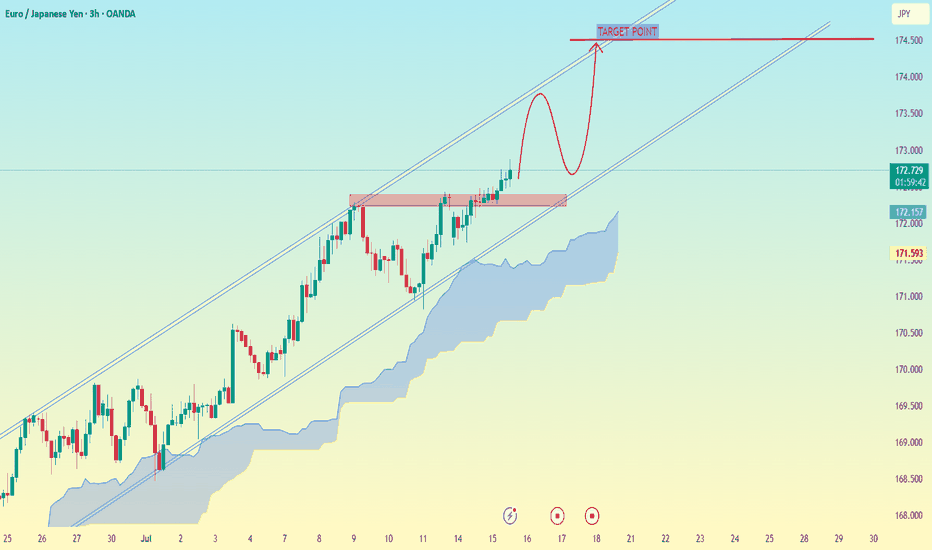
EUR/JPY (Euro vs Japanese Yen) on the 3-hour timeframe, the technical setup clearly suggests a bullish continuation inside an ascending channel, with a breakout above a consolidation zone. --- 🎯 Target Point (as marked on your chart): Main Target Point: 174.500 --- 🔍 Analysis Summary: The price has broken above a resistance zone (around...
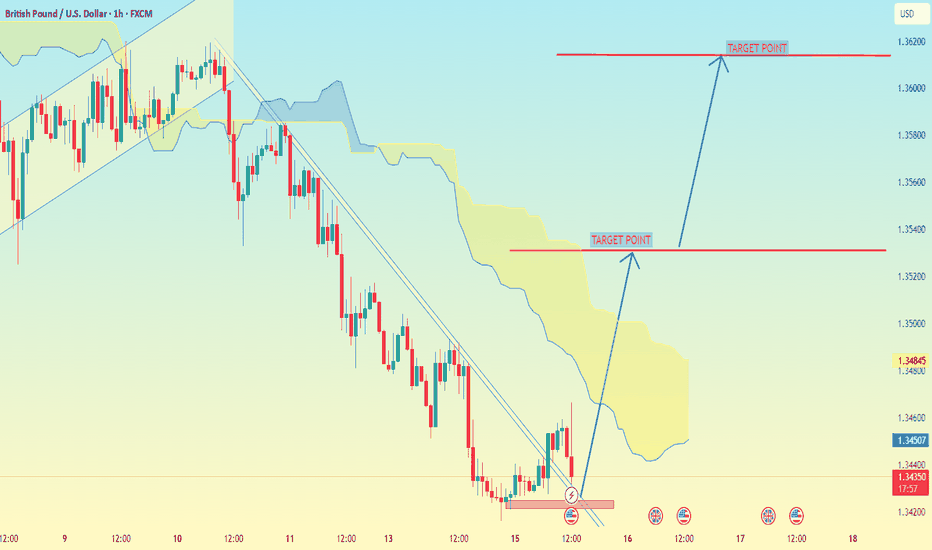
GBP/USD on the 1-hour timeframe, here’s a breakdown of the target points indicated: --- 📍 Target Points (as marked on the chart): 1. First Target Point: Around 1.35200 2. Second Target Point: Around 1.36200 --- 🧠 Analysis Notes (based on My setup): Im used Ichimoku Cloud and a trendline breakout, which suggests a bullish reversal. The price has...
(2-hour timeframe for WTI Crude Oil (USOIL)), here’s the technical analysis and target zones: 🟦 Key Observations: Price is trading in an ascending channel. I'm using the Ichimoku Cloud for trend confirmation. There are two clear target zones marked with arrows. --- 🎯 Target Levels (as shown on chart): 1. First Target Zone: ~$74.50 This is the...
Ethereum (ETH/USD) on the 2-hour timeframe, here's the analysis and target level: --- 🟦 Chart Observations: ETH is in a rising channel. Price is respecting Ichimoku Cloud support. A bullish breakout pattern is forming (consolidation above the cloud). My clearly marked "TARGET 3300" at the top. --- 🎯 Target Level: Primary Target: $3,300 This is the...
Tesla (TSLA) 1-hour chart im provided, here are the key bullish target points indicated by the chart analysis: 📈 Bullish Target Points (Upside Levels): First Target Point: 🔹 Around $338.00 – $340.00 This level is marked as the initial breakout target, likely based on recent price structure and resistance zone. Second Target Point (Extended Target): 🔹 Around...
Bitcoin (BTC/USDT) on the 1-hour timeframe: 🔽 Bearish Target Points (Downside Levels): First Target: ~116,157.55 USDT This level is close to the upper edge of the Ichimoku Cloud (Kumo), which can act as initial support. Second Target: ~113,686.49 USDT This is the deeper pullback level, marked clearly as the main "Target Point" on the chart. It aligns with...
USD/CHF (1-hour timeframe), the analysis appears to include: Ascending triangle pattern (with higher lows and a horizontal resistance). Ichimoku Cloud for trend analysis. Two marked target levels with projected breakout potential. Identified Targets: 1. First Target: 🔹 Around 0.80000 This is just above the current resistance zone and seems to be the initial...
GBP/USD chart (1H timeframe), potential breakout from a descending channel, supported by the Ichimoku Cloud and marked target levels. 📈 Current Analysis Highlights: Price is near the lower end of the descending channel. A bullish reversal setup is forming. I'm drawn two Target Points indicating a breakout and continuation. --- 🎯 Target Levels (as per your...
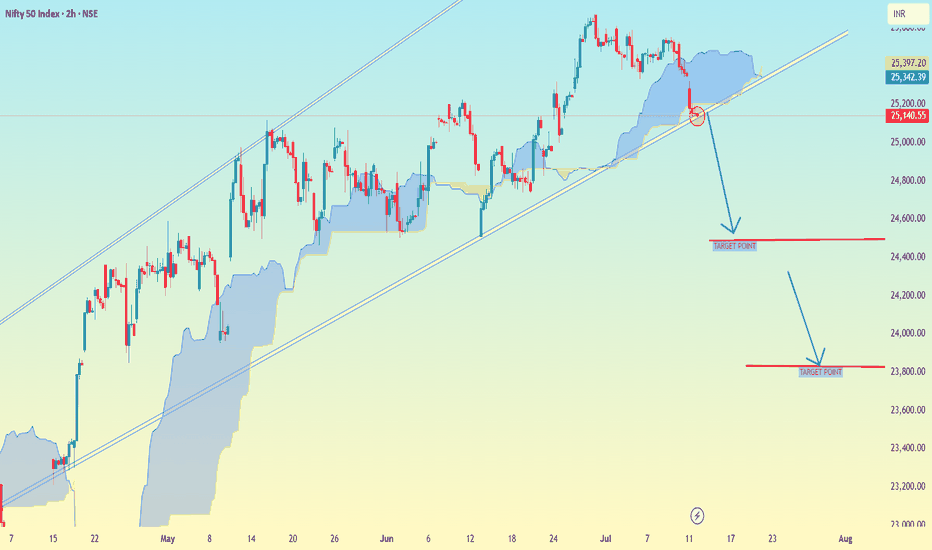
Nifty 50 Index (2h time frame), here is the analysis and potential target levels: 🔍 Technical Breakdown: Trendline Break: The chart shows a rising trendline which has been broken to the downside. Ichimoku Cloud: Price has moved below the cloud, indicating bearish momentum. Arrows & Levels: Two downward arrows suggest potential drop zones. 🎯 Target Levels (as...
(BTC/USDT) appears to be around $120,000. Here's a quick analysis of what the chart suggests: Timeframe: 1D (Daily) Current price: ~$111,150 Technical Indicators: Ascending triangle breakout is indicated. Ichimoku Cloud shows bullish momentum (price above the cloud). The breakout is targeting a horizontal resistance zone around $120,000. ✅ Target...
EUR/USD (Euro / U.S. Dollar) 2-hour chart analysis, here's the breakdown: --- 📈 Chart Setup Observations: The pair is showing a bullish breakout from a descending triangle or falling wedge pattern. Price is above the Ichimoku Cloud, suggesting a potential shift to bullish momentum. There are two clearly marked target points on your chart. --- 🎯 Target...
XAUUSD (Gold Spot / U.S. Dollar) on the 30-minute timeframe, 📈 Key Observations: The price has broken out of a descending channel to the upside. There is Ichimoku Cloud support below the breakout, indicating potential bullish momentum. Two bullish target levels are marked with arrows and horizontal red lines. 🎯 Target Levels: 1. First Target (TP1): Around...
BTC/USD 1H chart I shared, the chart shows a bullish breakout pattern forming (likely a symmetrical triangle breakout). Target Points Identified: 1. First Target: 📍 109,750 USD 2. Second Target: 📍 110,750 USD --- Key Notes: Breakout above the descending trendline signals a bullish move. Ichimoku cloud is thinning, suggesting possible momentum if price...
SOL/USD 2H chart, the price is forming a bullish ascending triangle breakout, and it's approaching the upper resistance trendline. If it breaks out with volume, a strong move upward is expected. 📈 Bullish Target Points: 1. First Target: ✅ $157.80 — This is the first horizontal resistance and initial breakout target. 2. Second Target: ✅ $162.00 — A higher...
