RealMacro
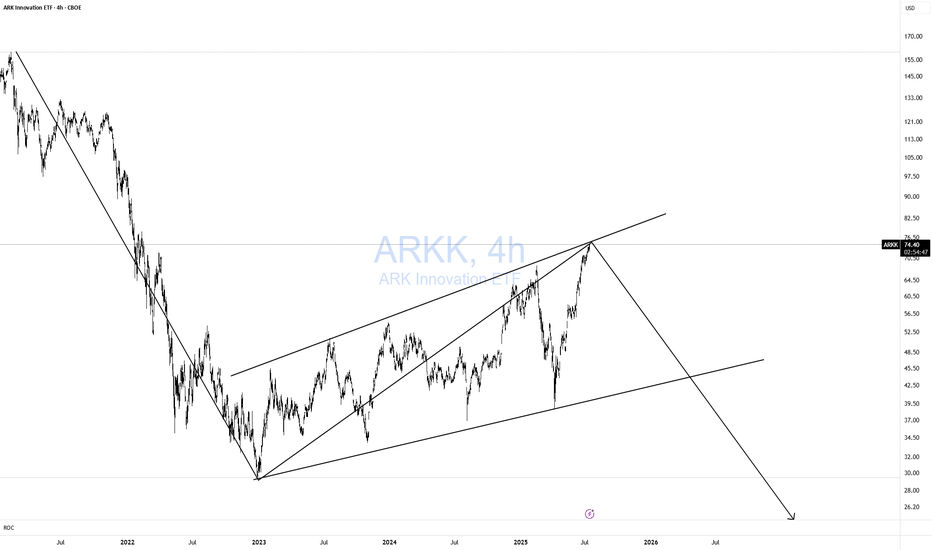
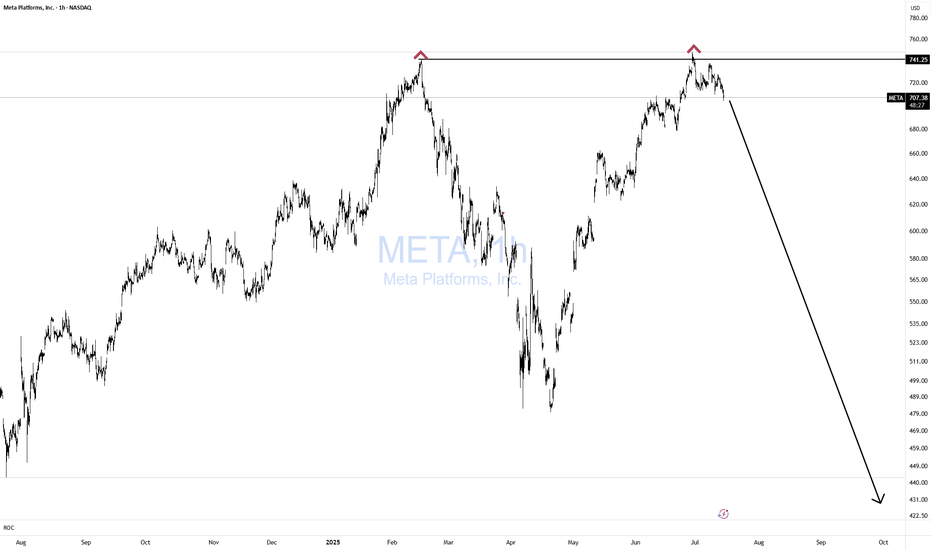
PremiumClassic breakdown move from a rising F flag! Massive Head and shoulders formed, that head test followed through, taking out stops, and now failing off the top of the channel. Screaming CAUTION to the bulls! Nice simple short setup for bears. Click boost, follow, and subscribe. Let's get to 5,000 followers. ))
I have been warning about this for some time. Please visit my previous two posts for more info and updates. Magic! Click boost, follow, and subscribe for more. Let's get to 5,000 followers ))
Bulls CAUTION! Price is whipsawing all over the place. Better to be out of the market wishing you were in than in wishing you were out!! Don't chase!!
Classic 123 wave move down! As I like to say Short when no one else is looking! Not when everyone is looking. TOO LATE! Simple but very effective pattern with excellent risk-reward. Remember, I am a macro trader, so don't expect to see a return on this investment tomorrow. I won't get into the macro stuff.
Does it get any easier than this? NOPE! If you can't spot this pattern from 1000 miles away, then you need a lot more time in the seat, training yourself in TA. Simple with great risk reward! Bulls GTFO!
This is an updated chart, as I keep being prompted to reach "My Target" by TV. No matter how bad things get for Elona and TSLA, there are always people who are willing to pile in and buy at any price. The problem is the chart is showing lower highs, as TSLA no longer attracts the people needed to boost price, just like TSLA the brand. As a result, people keep...
The Hagia Sophia pattern has now fully formed; it just needs the crack! and the Hook! No matter what your vague hunches and feelings are about AI, the charts will always win. You can't "buy the dip" unless you know when to "Sell the Rip"! If you can't see this resistance area, I don't know what to tell you. Everyone is bullish at the top of a bubbliotious...
Unfortunately, I keep getting forced to create new posts for the same Isea bc TV forces me to "target reached" on updates. Here is my previous post. We have yet another bearish formation setting up in GME. Rising bearish wedge. Wait for the CRACK! Click Boost, like, follow, and subscribe for more!
After Trump unilaterally imposed Tariffs (Taxes) on its citizens to buy imported goods from the rest of the world, promising 90 deals in 90 days, "in two weeks", the demand for the dollar payment system has collapsed by -12% reducing purchasing power for all $ holders'. Imports of goods mean exporting $s to the rest of the world. As a world reserve currency...
We once again see that MMT ("Modern" Monetary Theory) is 100% wrong. Milton Friedman wins again. "Inflation is always and everywhere a monetary phenomenon." Don't let modern economic hacks fool you.
As I have been warning for a while now. See previous post. I first warned to wait for the CRACK! Then we got the 2nd CRACK!, very normal. Then a nice M pattern with a lower high. Then another CRACK! And now a right Shoulder. MAGIC! Now we wait for the H&S to break down. Click boost, follow, and subscribe for more. Let's get to 5,000 followers. ))
I have to repost this bc TV only gives me limited updates before it forces "target reached." Here is my previous post. Nothing has changed. Just as I expected. If anything, it looks even more bearish now. As always, wait for the hook! Click Boost, and follow Let's get top 5,000!
TSLA has a beautiful big ars bear flag! While it should have broken down to trigger a short trade, it decided to Honey Tick people right into a Trap! It formed a perfect MEGAPHONE in wave 3 up that has now CRACKED! This is a much juicer short setup with the potential of collapsing from here and taking out the entire bear flag and MORE!! First, we need a lower...
Fun while it lasted. Even though I like AVGO, a crack is a crack is a crack! Rising bearish wedge. Time to take profits.
QQQ relative to the money supply reveals that markets have never been this expensive in history. Despite the significant amount of money pumped in during the COVID-19 pandemic, the economy has not kept pace with all the zeros added to Gov debt. If we can't lower deficits now at max employment, when will we? Tulips! Caution is in order despite what "experts" may...
Usually, these types of events are great selling opportunities as they are short-lived. However, this time may be different. I would expect a pullback then if it lasts and escalates a breakout. For now, just observe, have patience, and look for the 2nd crack! If it cracks a 2nd time, it is definitely not good for US inflation.
I will keep this simple. The rising wedge broke. Markets are in trouble. The Trump disaster keeps escalating every day. This is what the world looks like without the US strong leadership defending freedom and democracy. CHAOS!
GAME is one of the easiest stocks to short. Just wait for the bearish signal and take the trade. Over and over and over again. Anyone who wishes to learn what Bull Traps are should study GME chart.


