The outcome of this analysis is that based on the structure of a zero - D wave, which may be a pig or triangle, or even a pig, we should look for the optimal areas to buy Spot … In the event that this analysis is correct, it may be ideal to purchase Spot in the vicinity of Beijing to the tribes. A cautious target for the Chinese outbreak and a more risky target...
This is a long-term analysis for the weekly time frame. Our guess is that the price will return from around 0.012 to 0.015 and even higher (completion of wave 4) and then complete its wave 5 at around 0.053 to 0.041. If this happens, buying it spot is quite low-risk and we can even look at it for a long-term hold and an investment under one condition. If this...
A risky analysis of a popular meme coin.. Based on this analysis, we are in wave 4 and it is expected to end soon and enter wave 5.. Around 0.091 to 0.085, if the price reaches it, it will be suitable for a short swing to the target of 0.0163 and 0.0175.. Ideal time zones are also marked with low tolerance.. This analysis can be easily filled..
Based on this analysis, wave E is complete and any retracement to around 0.0000078 is a buying opportunity.. and around 0.000017 to 0.000022 is the possible end zone of wave F.. Even if the price returns to the levels of 0.0000058 to 0.000005 once again, it will still be an ideal buying opportunity to buy spot.. And this is just a simple analysis and there is a...
An analysis at the height of market fear.. A situation where all markets are experiencing sharp declines due to US tariffs and Middle East tensions.. It seems that around $0.25 is the ideal area for short-term buying for $0.75 targets and the ideal time to start this upward movement is early April.. Just an analysis that may be wrong..
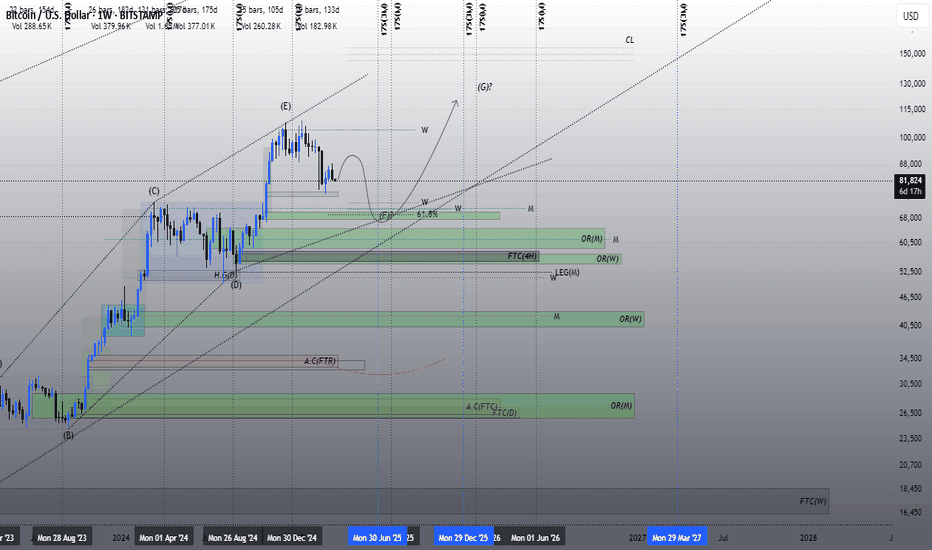
According to this analysis, if the price reaches around $70,000 in a corrective structure with a time-consuming and low momentum in the form of wave F, it may grow to around $120,000 and even higher in the form of wave G. But it seems that the ideal buying point is around $60,000 and the origin of the breakout node. In this case, of course, we will have a strong...
Based on this wave count and other considerations, we are probably in wave 4 and the areas indicated on the chart are ideal ranges for the bottom of wave 4 and the hunt for wave 5. Buying spot this currency around $0.011 to $0.0125 seems low-risk and reasonable. March 5th to 10th is an ideal time zone for the end of wave 4. Just an analysis that could easily be wrong.
This is a long-term analysis. To buy spot and medium term.. We may experience strong negative fluctuations, but it is worth the risk. The numbers 11.5 to 12.5 dollars and 8.5 to 10 dollars are attractive prices to buy.. It is better to look at this purchase as a short-term investment. Important trading times and nodes for the end of wave B and the beginning of...
It seems that this currency is in a strong upward structure. With the completion of the J wave, which is the last rally of the diametric pattern, it has the chance of a very strong rise. Just a technical analysis.
Based on the labeling and analysis, it seems that we have exited a large structure in the form of wave B, and probably the recent growth of wave 1 of the impulse series, which completes the big wave C for us. Spot buying around $0.36 can be done. be low risk..
According to the labeling that has been done and if it is correct, we can expect the start of an upward rally in the form of wave 5 of 3.. Spot buying around $0.0324 can be associated with less risk.
In the previous analysis, as expected, an ascending log was formed in the form of wave B. If this analysis is correct You can wait for the fall of dominance and therefore the possibility of an upward trend in the cryptocurrency market.
USDT Dominance has apparently completed its downward movement in the 4-hour time frame.. which has been completed in the form of an impulse that can be considered wave A or 1.. which of course we have named wave A for now.. In the following, an upward phase can be completed in the form of wave B. Based on this, we can expect growth up to 5% and even higher...
Getting to the good areas for the end of wave 5 Just an analysis that is likely to be wrong
A good setup with a high probability of success.. It seems that wave 4 is being completed. It is an excellent range for buying spots
Bitcoin's dominance seems to have completed an impulse and naturally it should enter a period of correction and take time. Modification can be in the form of any pattern.
Just a technical look.. Technical view means only analyzed chart and nothing else.. This analysis can be easily completed and the time frame is high, so it will take a lot of time.


