SIGNALS_VAULTFX
EssentialThe Bullish BAT pattern on the USD/CAD daily chart is structurally valid based on strict harmonic criteria. Although point D is slightly extended (91% vs. 88.6%), the confluence of Fibonacci levels and price reaction justifies a potential buying opportunity with favorable risk-reward.
On the GBPCAD chart, we have a bullish Gartley harmonic pattern that aligns with an upward trendline. I expect the price to move to the upside.
On the GBPAUD chart, we have a very beautiful bullish Butterfly harmonic pattern forming at a major support level. I expect the price to start moving higher.
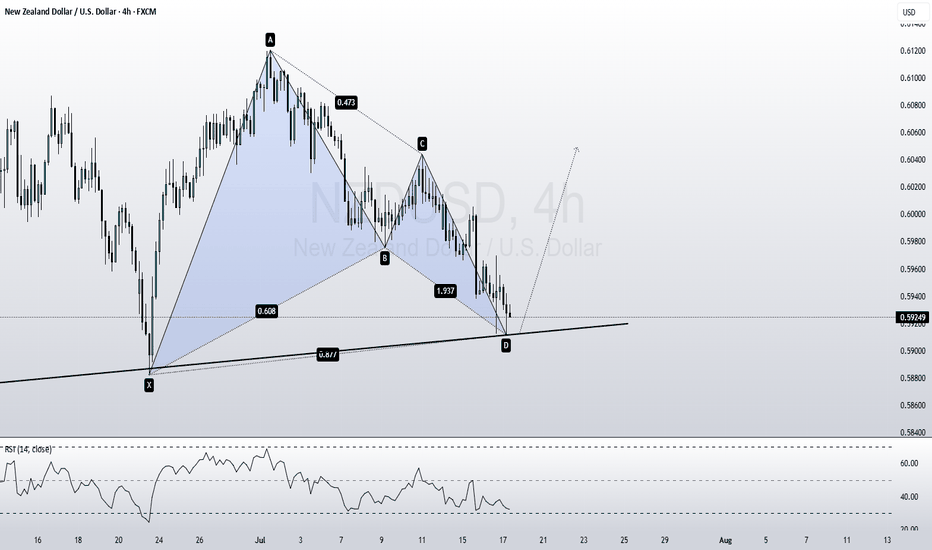
On the NZD/USD chart, we see a bullish Gartley pattern aligning with an upward trendline. I expect the price to move higher.
The price formed a Head and shoulders reversal pattern. If occur clear breakout then i expect it to move lower.
Swing Trade Idea – AUD/CAD The price is currently trading below the 50-day moving average, indicating bearish momentum. Recently, a strong bearish candle broke the previous market structure, confirming downside pressure. Based on this, I expect the price to move lower towards the target area, which aligns with the 261.8% Fibonacci extension level.
This is a very good short trade setup. The price is trading below the Ichimoku cloud, as well as the 50-day and 100-day moving averages. The bearish momentum is confirmed by the downward trendline, the MACD being below zero (indicating bearish sentiment), and the RSI, which is also below 50.
This is a trade setup based on a **Bearish Butterfly Harmonic Pattern**. The pattern meets all the key Fibonacci criteria for validity. Specifically, the AB leg retraces 80.8% of XA, which is close to the ideal 78.6% level and is considered acceptable, especially since it closed with a wick. The BC leg retraces 37.5% of AB, which is within the standard range of...
Price broke the structure with impulse movement, IF the price breaks the correction then i expect to moving further to the downside.
Price found resistance on previous resistance point, as well as 161.8% Fibonacci extension level. #technicalanalysis #forex #audusd
After a downward movement price found support and bounced to the upside with impulse movement. after that the price created a correction and broke it. Therefore i expect the price move further to the upside. Entry: 162.97 Tp: 164.49 Sl: 162.22 RR: 2:1 #forex #eurjpy #technicalanalysis
The price broke the downward trendline with impulse movement, retraced and retest the structure and broke the correction. i expect to move further tpo the upside.
The price broke the structure with impulse move and retraced. The price found resistance in previous low (inside resistance), where we have a 38.2% Fibonacci retarcement level, as well as 50MA, after that price broke the correction, so i expect the price move further to the downside. ENTRY: 1.3860 TP 1.3800 SL 1.3889 #technicalanalysis #usdcad #short
After a strong downtrend the price maybe find support approximately at level 0.8401 where we have a 100 DMA , as well as internal trendline. entry: Buy limit at 0.8401 TP 0.8462 SL 0.8364 (** Trading involve risk. Everyone is responsible for his/her decision).
After an upward movement price found resistance on major resistance point and currently correcting to the downside. i suggest short position entry: 1.3401 sl: 1.34696 tp: 1.3318 #technicalanalysis #gbpusd #forex
Price found resitiace on the trendline, as well as 100/200 MA, i expect the price move to the downside. entry: 1.1245 sl: 1.1284 tp: 1.1204
After a downward movement price found support at 38.2% Fibonacci retracement level, as well as 100 and 200 MA. entry 0.8339 sl 0.8297 tp 0.8382 #technicalanalysis #usdchf #forex
Price respected the upward trendline and additionally we have the confirmation that the price is above the 100 MA. entry 0.5365 sl 0.53349 Tp 0.5405 #technicalanalysis #forex #audchf


