SILICIDE
EssentialNAS100 has recently formed a Flag pattern and price is currently consolidating in the flag channel(box) pattern and wait for the breakout can easily take the price to 23500-23600.
EURUSD has formed a bullish flag and also price has reached the fib 0.5 level from where price will pullback and Price is likely to go up around 1.19.
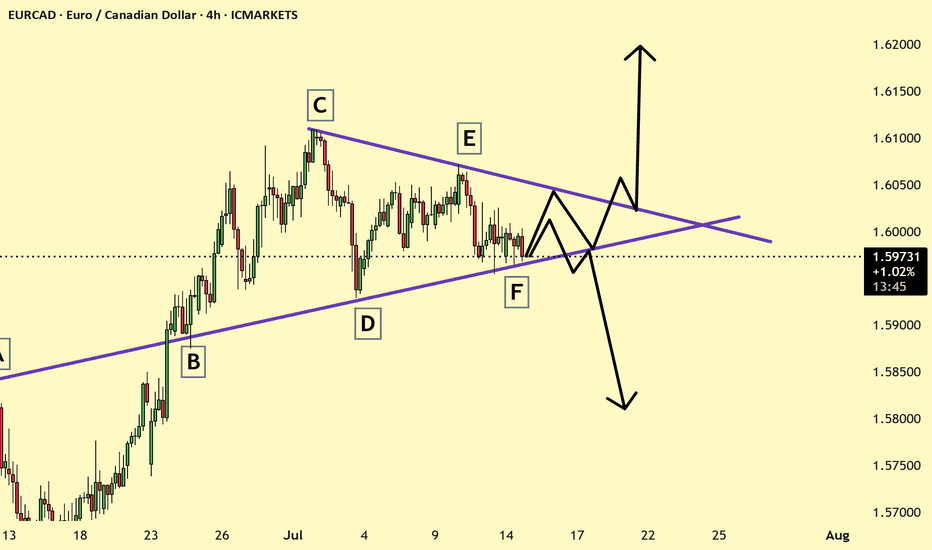
EURCAD is trading in triangle channel pattern and is at the support and wait for possible breakdown or barkeout? and trade accordingly.
GBPCAD is currently trending in a down trend and it broke the trend line support and soon may retest the resistance and may go down.
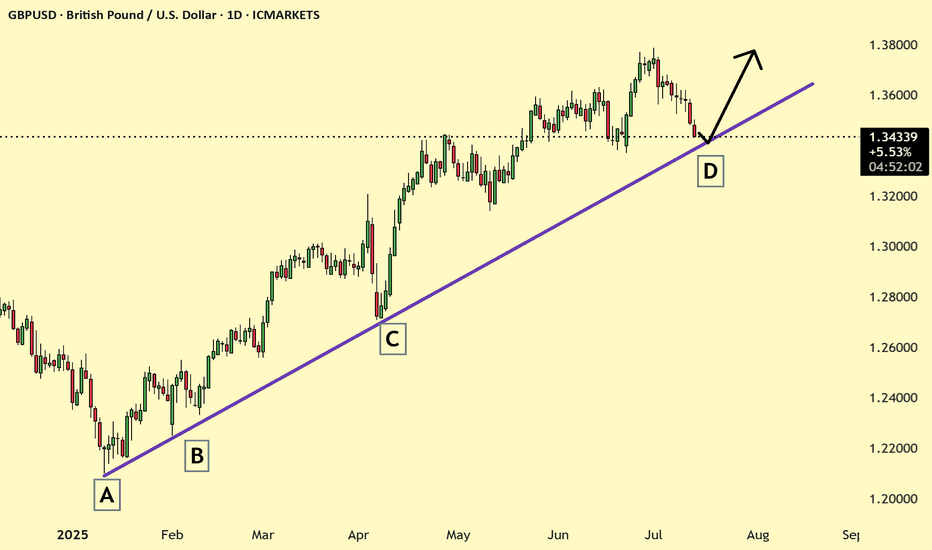
GBPUSD is Trending in uptrend and currently has reached trendline support and from this area the price may pullback to higher. Let us see
AVAX is currently in a downtrend and has approached a key support zone. Price action has formed a bearish flag pattern, suggesting a continuation of the prevailing trend. The market is currently in a correction phase within this flag. If the support fails and the pattern breaks to the downside, AVAX may slide toward the next bearish target around $14. However,...
BTCUSD is consolidating around 107,372 after a breakout. Two bullish scenarios are shown: a bounce from 106,408 or a deeper pullback to 104,766 before rallying. Key resistances lie at 110,342 and 111,830. Bullish bias holds as long as price stays above 104,059.
GBPNZD is currently trading within a range-bound structure. The price was recently rejected from the resistance area near 2.2700, but found strong support at the 0.618 Fibonacci retracement level, indicating bullish interest at lower levels. The pair has now formed a cup and handle pattern—typically a bullish continuation signal—which suggests a possible retest...
EURJPY has good rally recently and crossed fib 0.5 and now looks to be facing resistance at a trendline which was support earlier, on 4 hr chart look for breakout of this trendline and enter the trade.
Watch for rejection signals around 181–183.5. Unless there's a strong breakout above this zone, the pair is likely to reverse down toward 173–168 in the coming weeks. A break below 168 would be a major bearish shift.
ETHUSD recently in uptrend as par to correction the price has reached 0.618 Fib and price maty reverse if the bulls are Strong let us see....
AUDCAD has reached the resistance line of symmetrical upper trend line and price got rejected from here and may likely to go the support trend line. 4 hr chart makes it more clear.
EURAUD is currently in a well-established uptrend and trading within an ascending channel. The price is now testing the channel resistance, and momentum indicators suggest underlying strength that could support a breakout. If the pair successfully breaks above the current resistance zone, it may initially target the upper boundary of the channel around 1.815. A...
EURUSD monthly pattern showing price reaching the symmetrical triangle resistance and currently price is nearing the resistance and may soon the price may reverse and look for the reversal on 4 hr or daily charts.
GBPNZD has reached the 0.5 Fib and a trendline that may act as resistance which was a support earlier. The price has already rejected from this Area and may again reject from here.
GBPAUD has reached a 0.5 Fib where several times the price got rejected and on a weekly chart pattern also formed a strong bearish wedge now price have reached the top of this trendline expecting the price to go down and break the down trendline. Let us see.
GBPJPY is at key resistance around 200.6. If it fails to break and hold above this level, a retracement toward 194.5 and possibly 190.7 is very likely. Watch for reversal candles or confirmation around 199–201.
GBPCHF has reached the 0.5 fib level in uptrend will it continue the bullish movement, look for reversal trend on 4 hr chart and enter the trade.


