SJTRADESFUTURES
ModAfter a 100% move to the upside Solana is slowly cooling off its run and heading back down to some key areas of support . In this video I highlight where I think those reaction zones are and what I expect to see Long term from Solana . Set alerts and be sure to monitor BTC which will give you the additional confluence of understanding why the alt coins are...
In this video I recap my previous Nvidia video where I anticipated a rangebound price action with the possibility of a new low for longs leading towards Quarterly earnings. With the highly anticipated results only days away I outline the possibility for price to pull back into a really strong level of support for a possible long entry . Tools used TR Pocket...
Update on the Solana Price action after BTC s Correction . Next levels to be aware of
In this video I bring to your attention what we could possibly expect if we lose the current level and if we do then where is the next crucial zone to look for Longs. If you have read this then pls do Boost my work and any questions then leave them below
This video is a quick recap on the previous video after the levels I gave produced 30% move to the upside after patiently waiting for the move down to 90$. So what now is the big question after the unprecedented move we had yesterday . I outline the next best Short/Long setup and define why I think we stay inside of the range until Earnings Data .
In this video I cover the potential for oil to trade down into the 55 $ range and what confluences we have at this price region . Please support with a boost and I welcome any questions
Update on the video I posted 5 days prior , giving a heads up about the Quinquennial pivots at 55 USD . Congrats if you took this trade as it was a big one ! Support my work with a like and any comments I welcome beneath the video .
Monthly analysis done on the NQ with the ambition to connect with current price activity and gauge a deeper technical understanding on if this is just the start of a bigger correction for the year ahead . Tools used in this video Standard Fib , TR Pocket , CVWAP/ PVWAP Incorporating PVWAP and CVWAP into trading strategies allows for a more nuanced understanding...
This video is a recap for the short video I done at 21000 and the reaction zone at 16500. Played out exactly as laid out in the original video although much faster than I had anticipated. I cover the current PA and what could occur next .
In this video I discuss the market structure shift in Nvidia and highlight new levels to be aware of to the downside . Potential here for longs and shorts . Tools used Fibs, Gann Square , Speed Fan , Order blocks . Please Like and comment if you have any questions . Have a great Day and thanks for your support
Update on the Monthly chart with revised level which is worth noting on your charts and being prepared for . Enjoy the update and thanks for watching
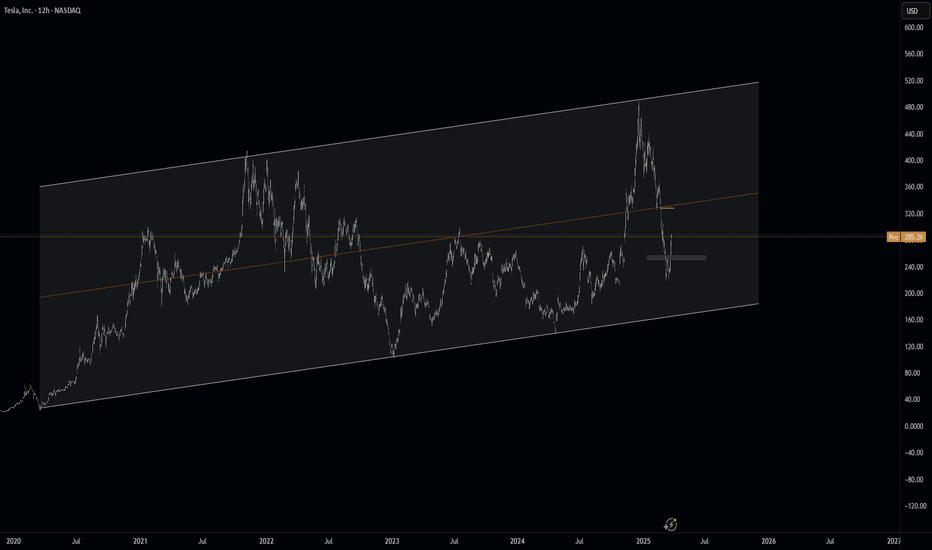
Quick recap of the previous level I gave for tesla which is now + 35% off of that level . In this video I use fibs and channels + gann box . Show your support for continued analysis with a boost and feel free to ask any questions
Must Watch Analysis on TSLA revealing the ultimate golden zone to fill your Longs and close your shorts. In this video I pinpoint a high probability zone of where to take the next long . I have used a suite of Fibonacci tools to include TR Pocket , Trend based fib, pitch fan , 0.618, VWAP and volume profile to determine the best Long.
Hi in this video I highlight what to look for in the chart to take shorts and where to fill Longs next . In addition to that I provide a small educational idea of looking out for Wickless candles and how they can add value to your analysis . Please like follow share and ask any questions that you have and thankyou for your support
Update video on the google Long that has been planned since early FEB. The level has now been hit and we got a nice reaction off that level . In this video I look into where I think we go next and how price plays out . In the video I use the following tools TR Pocket FIB , 0.618 FIB , Pivots , Parallel Channel and the Fixed range Vol Profile. If we stay...
In this video I look at the NQ on the daily and pinpoint whats possibly next for longs and shorts . I highlight a key zone to look for Longs that you need to mark on your chart .
In this video I Breakdown a couple of potential Targets for longs .
Update to the original Solana video I posted on Trading view 22 January


