dxy is falling since it peaked in Q4 2022 since their last 75bps hike dollar is constantly falling and stocks, gold, bitcoin constantly rising and making new all time high wave W = wave Y (equal in length, 100% projection for wave Y) since starting of the year due to trump tariff dollar is falling this is year in first half dollar saw biggest collapse since end...
gold price peaked on intraday h1 chart on 3450 level despite shocking war news opposite to crowd consensus price came down last two week until crowd give up buying war news but price was falling like text book from trend line test bounce then new lower low (price now testing h4 support 3245)
price breakout in first week of june then sideways entire month during same time gold was selling off below $3430 resistance and fed was very hawkish on stagflation if buyers stopped buying and seller come in then price can breakdown then neckline of pattern
fomc member repeatedly saying this is not stagflation like 1970s but gold bug on social media constantly pump stagflation narrative after gold historic run from $2000 to $3000 in just one year with usa cpi and gold chart in one image you can get idea how gold moved in last stagflation crisis with big political news : when paul volcker comes into fed and when...
gold price went up in last march month but rising price has made a clear parallel channel on h4 chart price testing upper line and get intraday rejection instantly. if price start correction then lower line of the channel will be next big dynamic support level
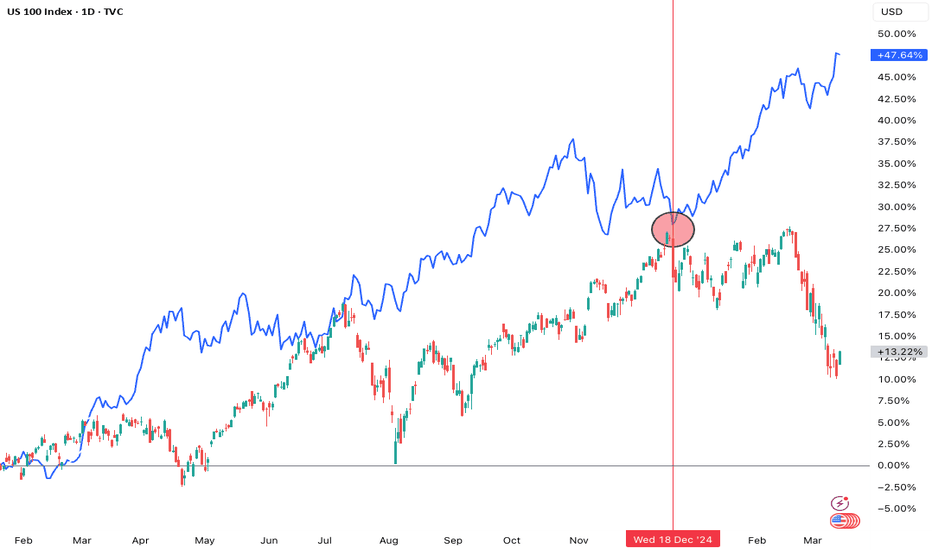
since fed did its last rate cut in december 2024 fomc, Stocks down gold up this is classic recession trade - dump risk assets and buy safe heaven gold hit $3000 on recession panic market crash if stocks bounce, panic may price out if stocks fall more, panic selling will trigger which could slow the speed of gold rally this market action and recent gold bars...
price falling on growth concern if trend line breakdown then there could be deflationary water fall
gold price are making higher highs with higher low and going rocket on trump trade war lower trend line big support level as long as price trading above lower white line it is bullish if lower line breakdown then $2720 big support level hawkish fed risk because tariff war has increased inflation expectation until it changes again on nfp on friday
before last fomc meeting gold collapsed in big but since fomc rate cut last time gold is constantly going up making higher highs with higher lows a clear up trend wxy waves subdivided into small degree abc waves has reached big static horizontal resistance level $2720 a blue parallel channel with upper line tested near resistance on last friday projection...
since first rate cut gold price is sideways price has made new symmetrical triangle pattern on daily chart wait for breakout then trade in new direction this week big news nfp then trump first day in white house can be trigger
price collapsed on fed hawkish dot plot but since than it is doing up side correction this yellow trend line has become strong support level on h4 intraday chart
gold price again flying on the news of china central bank gold buying since monday market open while market totally ignored strong nfp, rising cpi number and overheating financial market if white line and yellow horizontal level both at same place breakout at the same time technically it will be big bullish signal and investors will buy more if fail to breakout...
bitcoin is flying on many news end of QT, fed cutting rates into assets bubble, trump making it strategy research assets and many more after flag pattern breakout current impulsive wave length is same as previous wave before beginning of flag pattern near big psychological mark 100k
price has made new low of the range price testing big horizontal support zone price testing 50% fib of two years old bull market lets see how fundamental analysis aka monetary economics fit into this simple fib retracement and market found a reason to go up from here
where gold price will go next ? all levels on chart directional blue line on chart after big dump price first need correction
gold price are going up inside a yellow parallel channel price is making higher highs with higher lows so technically it is up trend until lower trend line breakout price not only testing upper line of channel it is also testing big psychological level $2800 near upper trend line today is last day of October month tomorrow we will have last nfp number before...
since gold meltup this year silver also going up but there is long term elliott wave target near $31.71 price made head and shoulder pattern than neckline breakout now retest of neckline ( as your horizontal resistance) and target new lower low is final setup in head and shoulder pattern
on weak dollar gbpusd is going up making higher high with higher low inside a yellow parallel channel 1.34297 first big resistance lower yellow line first big support


