Here’s my updated resistance zone analysis for GBP/USD, combining all the technical and fundamental data: Resistance Levels & Why They Matter 1.3265 – Immediate Resistance GBP/USD tested this level today, and it acted as a short-term barrier. This level aligns with recent swing highs and pivot point calculations, making it a key area where sellers may step...
I entered long at 1.32273 on April 15, and as of now, GBP/USD is trading around 1.3252, meaning I'm already up. Why I'm Staying Long Trend Confirmation: The daily chart still shows a strong uptrend, and moving averages confirm that GBP/USD has been trading above key levels. The RSI is at 62.76 on the daily timeframe, meaning bullish momentum is intact but not...
Hello this is my take on GBPUSD. Given the broader bullish trend in GBP/USD, I believe a long trade is the best play right now, but I’ll be watching key technical levels and upcoming news events to time my entry properly. Technical Indicators Supporting a Long Trade Trend Confirmation: The daily moving averages (EMA, MA, and TEMA) continue to show an upward...
I've been closely watching GBP/USD, and as of now, the pair is trading at 1.31771. Based on my technical analysis and upcoming market events, I believe the best trade setup is a short position, but only after confirming a rejection near 1.316–1.317. Why This Short Trade Makes Sense Overbought Conditions The daily RSI is at 76.08, meaning the pair is in...
I've been closely watching GBP/USD, and as of now (with the pair trading around 1.31808), I see it moving within a tight consolidation range—roughly between 1.307 and 1.320. Given that I'm near the upper end of this range, I feel that jumping in right away could expose me to potential reversals or whipsaw moves. My plan is to take a short position, but only after...
I've been closely analyzing GBP/USD this week, and here's my updated view based on all the technical indicators and fundamental data. Price Action & Key Levels Right now, GBP/USD is trading at 1.31537, after rejecting 1.320 resistance earlier in the session. The market made a strong attempt to break above 1.320, but sellers stepped in, causing a pullback. Given...
I've been analyzing GBP/USD closely, and here's my outlook for this week. The pair is currently trading at 1.31123, testing a significant resistance zone that has been crucial in recent sessions. Technically, short-term indicators show overbought conditions—the RSI on the 1-minute chart is at 87, and Stochastic RSI is at extreme levels, both signaling a high...
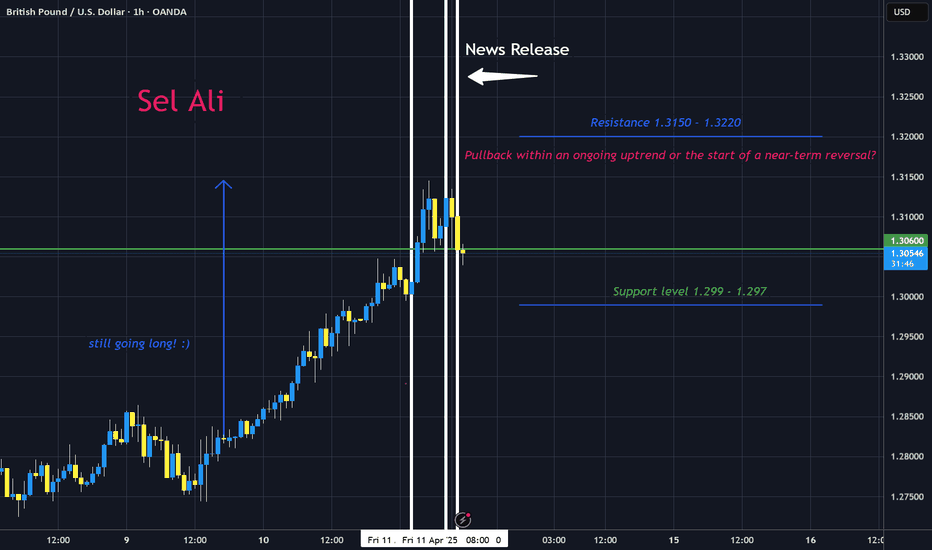
I’ve been closely analyzing GBP/USD, and right now, I’m assessing whether the recent drop is just a pullback within an uptrend or the start of a full reversal into bearish territory. Pullback vs. Reversal: What I’m Looking For Pullback Characteristics: A pullback is typically a short-lived dip before the trend resumes. If GBP/USD stabilizes around 1.3030–1.3050...
My Near-Term Views Fundamental Context: The UK data mixed signals (with a stronger-than-expected GDP but a much-worse trade balance) juxtapose with softer US indicators (a negative PPI and lower consumer sentiment). Although these fundamentals create some uncertainty, they suggest that sterling might face headwinds if worsening trade data weighs on expectations....
Hello everyone so this is my analysis over the past couple hours. I mean you guys can obviously see GBPUSD bullish. Let's dive a bit deeper into what's really happening... Fundamentals: I'm seeing stronger GBP data coming into focus for Friday, April 11, 2025. Recent reports show that the UK's trade figures are working in its favor—for example, the non‑EU Goods...
Mind you, i still have a bullish trade going from my previous long trade.. I removed my take profit yesterday and im continuing to monitor the market. but as for now these are the numbers we are looking at. The market has really overextended itself—prices are at levels that feel too high compared to the earlier consolidation. On the 1‑hour, 4‑hour, and daily...
Sorry I cant draw for shit. but this is my educated guess lol
Current Price & Overextension: The price is currently at 1.29380, which is still well above the recent consolidation range of 1.281–1.285. This tells me the market remains overextended, suggesting that the strong rally may be due for a pullback. Technical Snapshot: On the 1‑hour chart, my moving averages—such as the EMA, DEMA, and KAMA—are aligned near the price,...
Price Action Overview: From 1:00 AM to 10:00 AM today, I see the price steadily rising from around 1.2829 to a current close of about 1.29131. The 10:00 candle even touched a high of 1.29248. This sequence suggests that the market is testing the upper bound of the recent consolidation range. Consolidation and Potential Overextension: Although the movement from...
I’ve analyzed all the information—the price action, indicators, candlestick patterns, and the fresh fundamental news—and here’s why I believe this trade is compelling: Overextension and Price Structure: Right now, the price is at 1.29490, which is significantly higher than the recent consolidation range of 1.281–1.285. This tells me that the market has pushed far...
Technical Analysis Summary (Multi-Timeframe View) Price Structure & Patterns Higher lows since April 8th = bullish market structure Several bullish candles (belt-hold, closing marubozu, doji on higher TF) suggest momentum shift upward The bearish harami on the 30-min adds caution — likely short-term consolidation, not reversal Support & Resistance...
Given the data and technical indicators for GBP/USD, here's a breakdown of potential trading options: Key Indicators: RSI (Relative Strength Index): The RSI for multiple timeframes is somewhat low (19.44 on the 1-minute chart, 40.47 on the 5-minute chart, 59.50 on the 15-minute chart, and so on). A low RSI value often indicates that the asset is oversold, which...
Summary of Key Indicators for GBP/USD Trend & Direction: Directional Strength: ADI is high (61.07) with PLUS_DI (26.11) far exceeding MINUS_DI (6.65) and a DX of 59.41—confirming a robust short-term bullish trend. HT_TRENDMODE: At 1.0, indicating an active trend. Moving Averages & Price Forecast: Core Levels: EMA (1.31065), DEMA (1.31396), TEMA...


