SiDec
PremiumZORA has been on an explosive run, pumping +1239% in just 20 days. But after such a vertical move, the question is: Is this rally nearing exhaustion? Let’s dive into the technicals 👇 🧩 Elliott Wave Structure Looking at price action through the lens of Elliott Wave Theory, ZORA appears to be completing its 5th wave: ➡️ Wave 3–4 zone: Held around the $0.05...
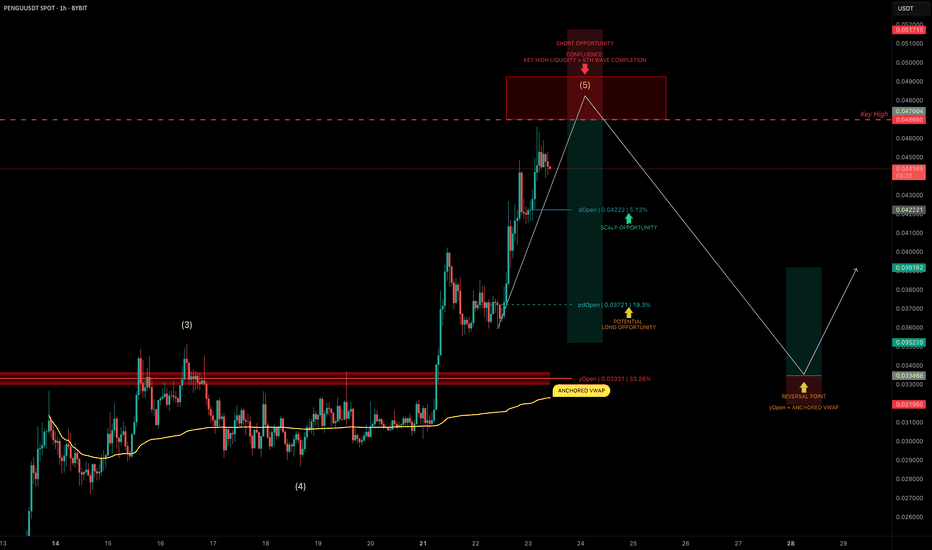
PENGU has had an explosive run, but it now looks to be nearing completion of wave 5 of its current Elliott impulse. We’re approaching a key high at $0.04698, a likely liquidity grab zone — and potentially a great area to position for a short trade. 🧩 Short Setup Overview ➡️ Wave 5 Completion Incoming: Price is showing signs of exhaustion as it approaches...
XLM has been one of the top movers, sweeping the January 2025 swing high at $0.515 before stalling and moving sideways for the past 4 days. Is XLM gearing up for another push toward the highs, or is a correction imminent? Let’s dive into the details. 🧩 Market Structure & Fractal Pattern XLM skyrocketed +132% in just 13 days, mirroring the explosive move seen...
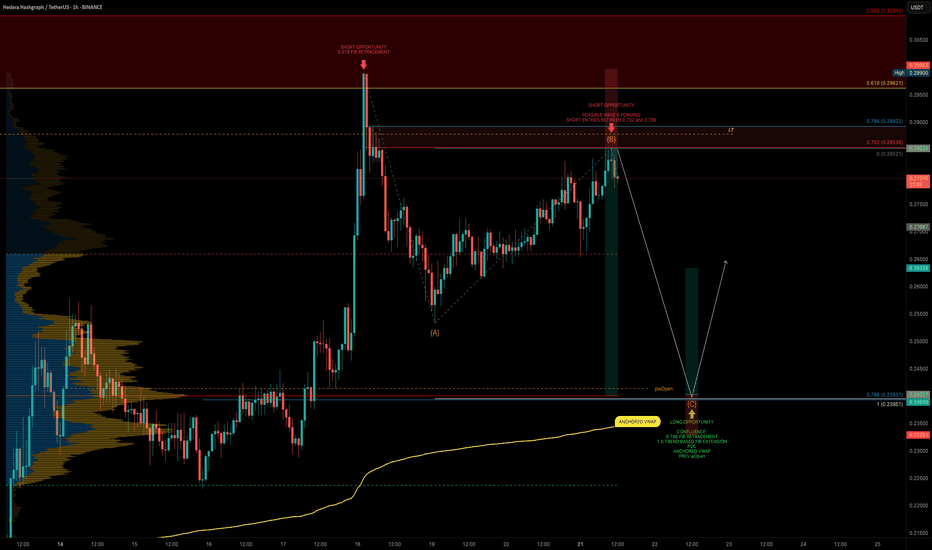
HBAR has been moving strongly and is currently offering both short and long trade opportunities based on a clean potential ABC corrective pattern, key fib levels, volume profile, and anchored VWAP. Let’s break down the setup. 🧩 Technical Breakdown Higher Timeframe Confluence: 0.618 fib retracement from the macro move 1.618 trend-based fib extension 1.272...
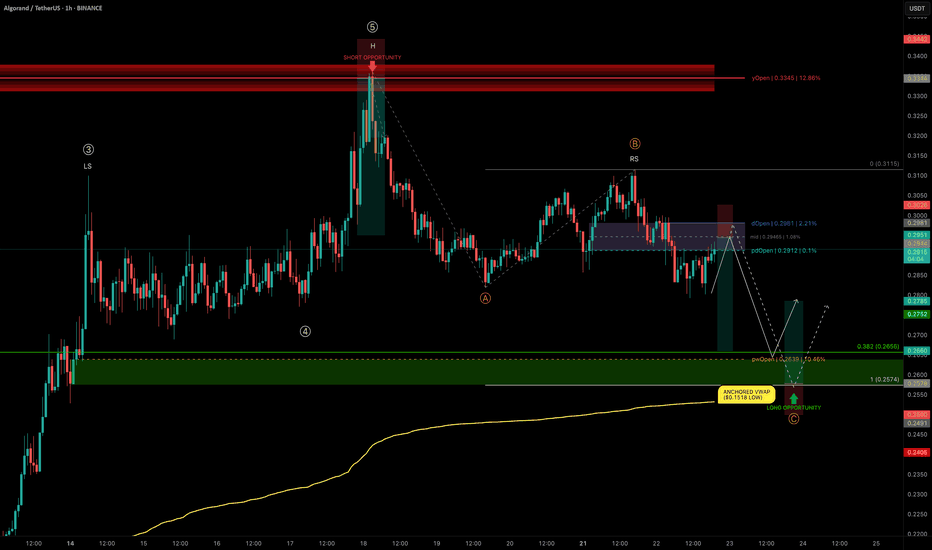
ALGO has delivered an impressive +124% rally from $0.1518 to $0.336 in just 25 days, completing a 5-wave Elliott impulse right into the yearly open resistance. We are now in a correction phase, and the current structure is showing a head and shoulders pattern, with the right shoulder currently forming. Let’s break down the key levels and setups. 🧩 Technical...
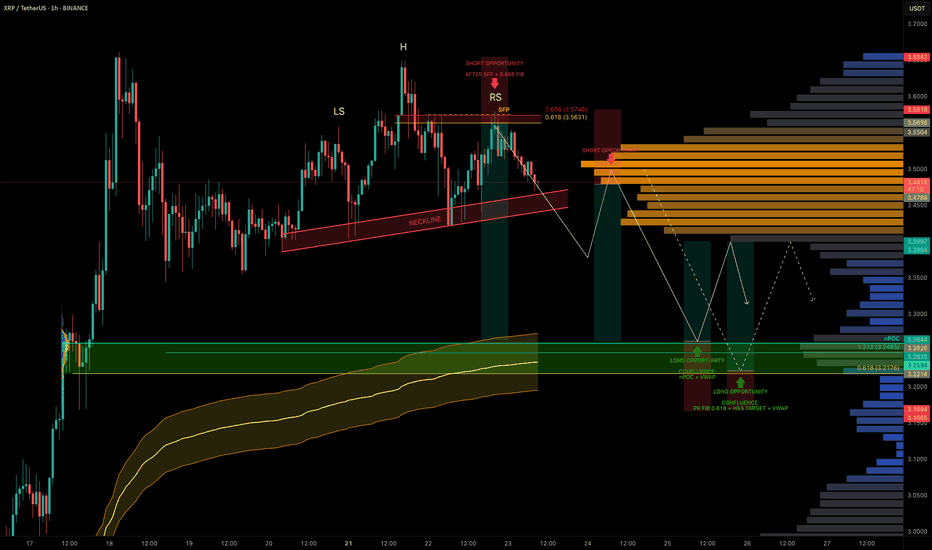
XRP has been stuck in a trading range around $3.50 for the past 5 days, offering multiple trade opportunities within the chop. A notable short was triggered after a swing failure pattern (SFP) at the 0.666 fib retracement level near $3.563. Now, with liquidity building to the downside, we’re watching closely for the next high-conviction setups. 🧩 Current...
SUI has been technically clean, with well-respected Elliott Wave counts and fib levels. As the broader market dips, it's time to look for sniper long entries and SUI is setting up beautifully for one around the $3.50 zone. 🧩 Key Confluence Zone: $3.50 This level offers a high-probability buy zone, backed by multiple layers of technical confluence: 0.786...
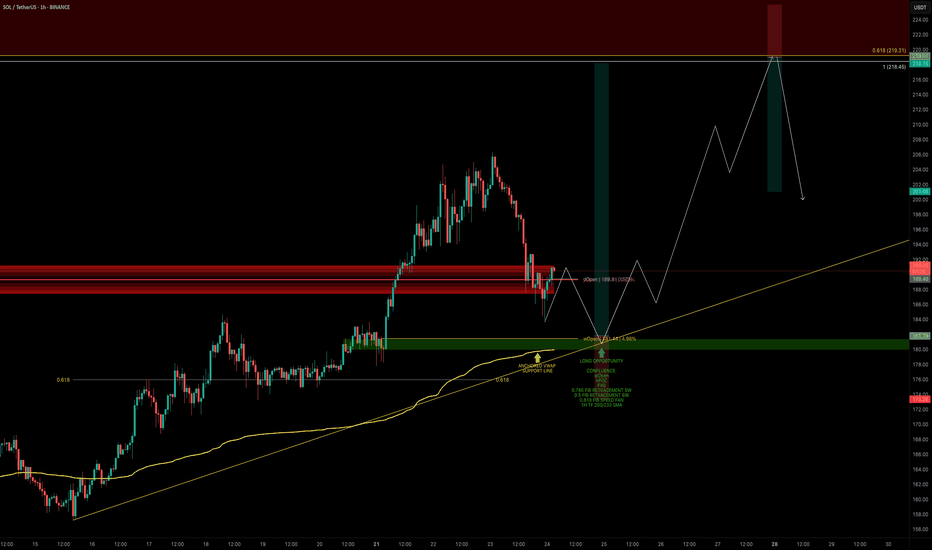
SOL has finally broken through the $180 barrier decisively — a key zone it failed to clear back in May. Now we’re seeing a retest, which may offer one final dip before continuation. Let’s break down the next high-conviction long opportunity. 🧩 Key Retest Zone: $182–$180 ➡️ Retesting Prior Resistance as Support SOL broke above $180 with conviction and is...
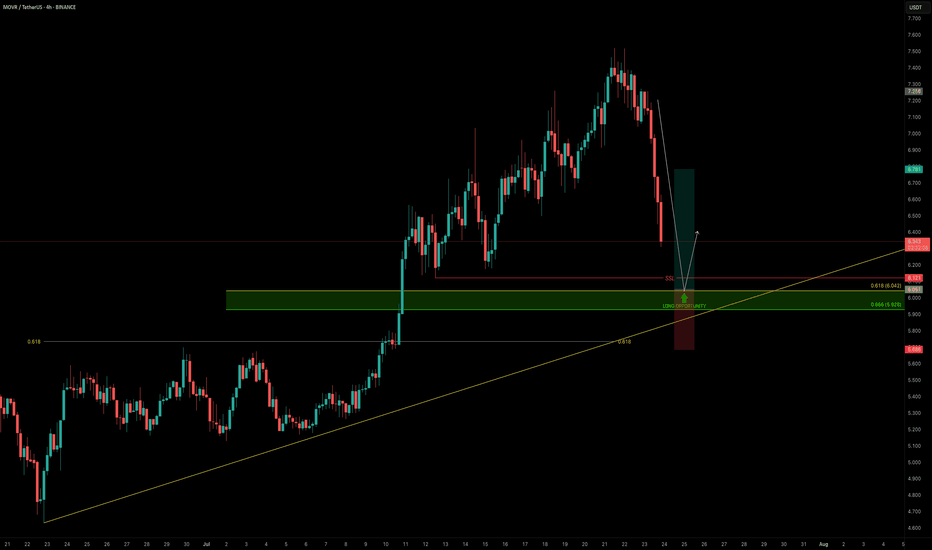
As the broader market pulls back, it’s the perfect time to scan for high-conviction long setups — and MOVR stands out. Price is approaching a strong confluence support zone, offering a solid long opportunity. 🧩 Key Technicals ➡️ Liquidity Pool Below the Low: There’s a visible liquidity pocket just beneath the swing low at $6.121 — an area where stop hunts...
ETH has been on an absolute tear. After retesting its old 2018 all-time high, it marked a bottom at $1383 — a brutal -66% correction over 114 days from the $4109 top. From there, ETH ripped +100% in just one month, followed by 40 days of consolidation, and now, over the past 28 days, it’s surged another +76%, currently trading around $3715 — all without any major...
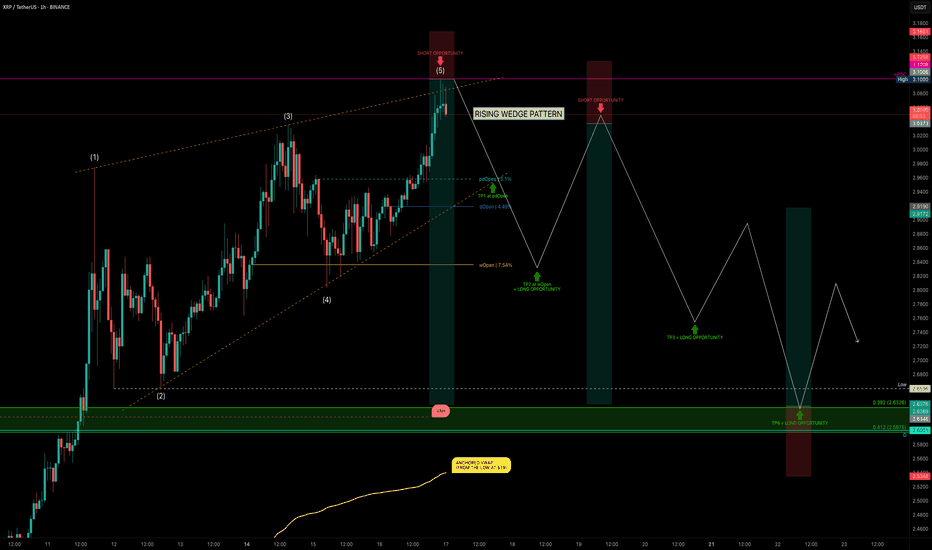
XRP has been on a strong run over the past 24 days, rallying from $1.90 → $3.10 — a +62% price increase. But after hitting key resistance, is XRP about to correct, or will it break out further? Let’s dive into the technicals. 🧩 Market Structure Rising Wedge Pattern: The current market structure resembles a rising wedge, with XRP likely completing wave...
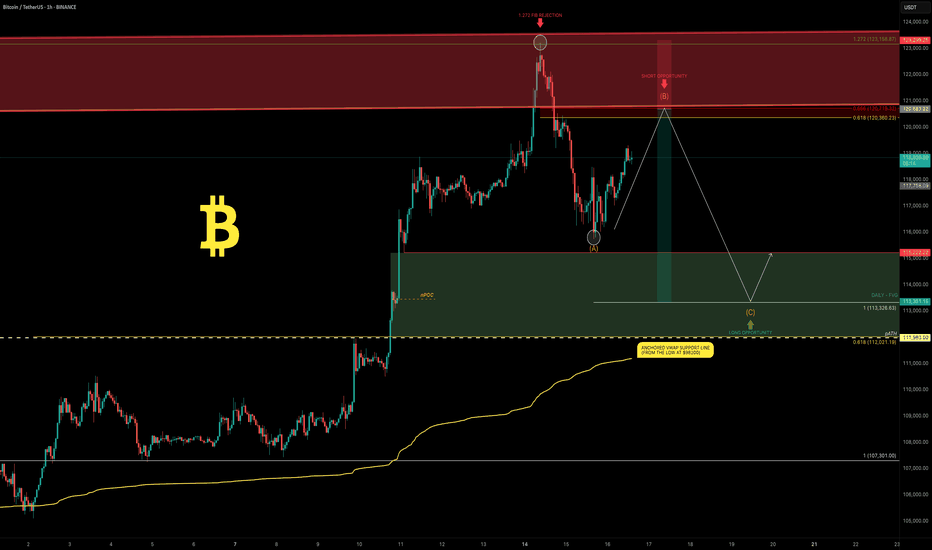
Bitcoin had an incredible run, breaking the old all-time high ($111,980) with strong bullish momentum and setting a fresh ATH at $123,218 (Binance). We just witnessed the first major corrective move of ~6% and a decent bounce so far — but the big question is: What’s next? Will Bitcoin break higher over the summer or form a trading range here? Let’s dive into the...
Bitcoin has been consolidating in a tight range between $110K and $105K over the past two weeks. This weekend’s attempted breakout stalled out quickly! BTC was rejected at the Point of Control (POC) of the previous range and came close to the 0.786 retracement of the recent drop. 🧠 Reminder: Weekend pumps are notorious for being unreliable, especially without...
After an explosive +392% rally in just 70 days — from $9.298 to a peak of $45.8 — HYPE has entered a consolidation range as expected. Structurally, this appears to be a 5-wave impulse now transitioning into a corrective ABC pattern. Based on current structure, we may now be forming wave B. What’s Unfolding Now? A potential Head & Shoulders pattern is...
RAY marked its bottom in December 2022 at just $0.133, entering a prolonged accumulation phase that lasted nearly a year. Then, in late 2023, it broke out into an explosive bull run, skyrocketing +6421% over 756 days and peaking at an impressive $8.70. This run completed a full five-wave Elliott Wave structure. After topping out, RAY dropped -84% down to $1.388 —...
Bitcoin has been locked in a range for the past 45 days, clinging above the critical psychological support at $100K. But cracks are starting to show… Every bounce from the key level at $102,430 has been weakening — and now, for the first time, we’re breaking cleanly below it. Things are starting to tilt bearish. So the question is… ⛏️ Will 100K be tested...
After a strong rally back in 2024, ONDO topped at $2.15 — completing a clear 5-wave impulsive move. Since then, price has entered a prolonged downtrend, dropping over -70%, with no confirmed reversal signs yet. We’re now trading around a critical zone near $0.70. So the question is: where’s the next potential bottom? 🔎 Technical Breakdown: 📍 VWAP Breakdown: The...
When people analyse the crypto market, they often default to Bitcoin and for good reason. It’s the one and only, the king. But sometimes, to see the forest instead of just the tree, you need to zoom out and study the broader picture. That’s where the Crypto Total Market Cap (TOTALCAP) chart comes in. It’s essentially the mirror of Bitcoin, but it offers powerful...


