SiDec
PremiumSince topping out at $0.20151, HBAR has spent the last nine days in a corrective pullback. Digging into a rich confluence of supports that offers a long trade setup. Here’s how to spot the high‑probability entries, manage your risk, and scale out for maximum reward. Current Context Two days ago, price was firmly rejected at the weekly open ($0.19029) right...
One of the most common mistakes traders make—especially in fast-moving markets—is jumping into trades impulsively at major resistance. It feels exciting when price is surging, but ironically, this is often where risk is highest and reward is most limited. Why? Because historical resistance zones—like the $175–$183 region on SOL—tend to attract heavy sell...
SUI’s movement is rapid, sharp swings—both up and down. In volatile conditions like this, we aim 0.702–0.786 fib retracements (and occasionally 0.886 in harmonic contexts) for high‑probability entries. Below is a clear, Elliott-focused breakdown of the current setup and both long and short trade plans. Before diving into the charts, let’s cover the basics of...
SUI has once again delivered a textbook display of wave structure, Fibonacci precision, and anchored VWAP interaction. After finishing Wave 4, price surged upward, tagging key fib levels and now consolidating at a critical decision point. The next high-probability trade opportunity is forming — and it’s one worth watching closely. 📈 Recap of the Current Move...
Yesterday, SOL gave a sharp downside shakeout, dropping from the weekly open at $147.98 (perfectly retested) down to the 0.5 Fib retracement of the swing at $140.25. Here’s a structured breakdown of the key levels, trade setups, and R:R profiles for both longs and shorts: 🔑 Key Levels & Confluences 1. Higher-Timeframe Opens Weekly Open & Retest: $147.98 –...
For the past 136 days, THETA has been in a strong downtrend, shedding an incredible -82% from its high at $3.351. Recently, it tapped into a major support level at $0.617, interesting that it's like the golden ratio 0.618. And it bounced off it beautifully. Over the last few days, we’ve seen a notable surge in volume, hinting at potential accumulation. Could this...
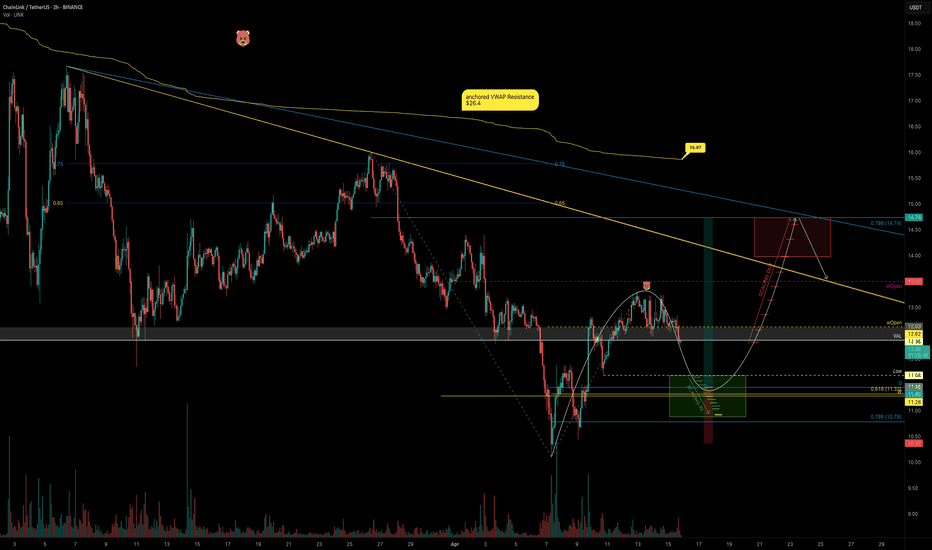
Buckle up! LINK has been riding a relentless bearish trend for 113 days, ever since it kissed its peak of $30.94 back in December 2024. With economic uncertainty casting a shadow over the markets and fear gripping investors, the big questions loom: Is this the dip to buy while others panic-sell? Or is it wiser to sit on the sidelines? Let’s slice through the...
LINK bounced right off the $10 mark, charging upward toward the monthly open before slamming into resistance around $13.25. But now what? Let’s break it down — because the next high-probability setup is taking shape, and it’s one you don’t want to miss. The Current Situation: LINK is: Below the Point of Control (POC) of this trading range (~$11.35). Below...
🎢 The Great 112‑Day Drop What happened? Over the past 112 days, ETH tumbled –66%, sliding from $4109 down to $1383 and oh yeah, it even poked its nose below the January 2018 all-time high. 7 years ago! Support Zone: 0.786 + Volume Profile 0.786 Fib: $1,570.85 (drawn from the 2022 low $870.80 to that $4109 high). 5‑Year POC: $1565 Hold Tight: For 2...
On April 3rd, AERGO hit a historic low of $0.04746—and just 13 days later, it's trading around $0.60, an astonishing +1500% surge in less than two weeks. The rapid rise begs the question: What are the bulls aiming for next, and how sustainable is this move? Key Observations: Explosive Rally: AERGO’s meteoric move from $0.04746 to $0.70 in just 13 days has...
After finishing the 5-wave structure in early 2025, XRP had a rough patch, trading between $3 and $2 and offering some pretty neat swing trade opportunities. Now, two months later, the big question is: will this range continue, or is a breakout on the horizon? Let’s break down the key levels and high-probability setups. Short Trade Setup Resistance Zone: ...
Solana continues to respect technicals with precision — after a +42.9% move from the $95 low, we're now at a pivotal moment in price structure. Let’s break down what’s happening and where the high-probability setups lie. 📍 Key Bounce Zone – Golden Pocket Confluence Local Low: $95.26 Golden Pocket Zone (0.618–0.666): $97.09–$94.82 This area acted as a major...
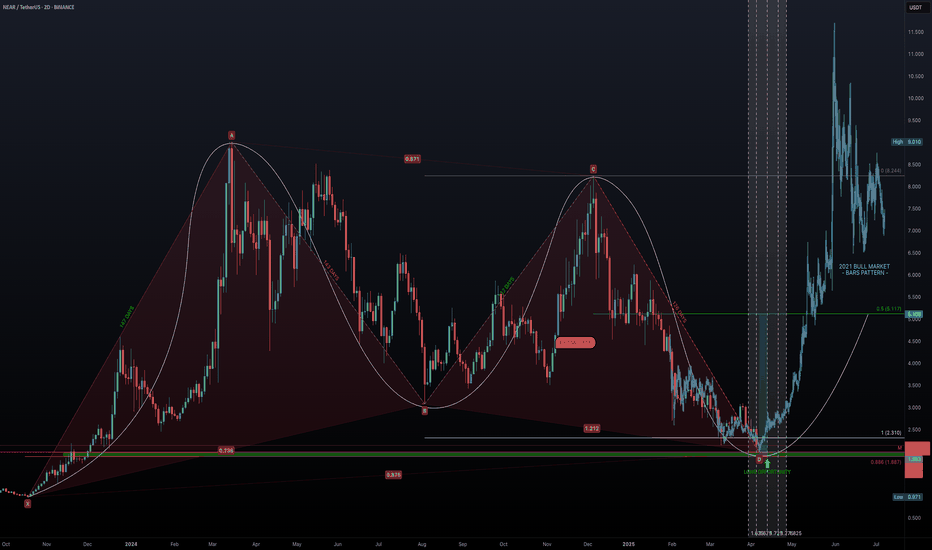
Back in October 2023, NEAR embarked on an incredible bull run lasting 147 days, surging from a low of $0.971 to a high of $9.01—an astounding +828% gain. Following this euphoric phase, the market sentiment shifted dramatically. Over the subsequent 392 days, NEAR retraced to around $2, marking a -78% decline. Now, with the market at a critical juncture, the...
Litecoin (LTC) has just broken below the critical $80 low, signaling that bearish pressure is firmly in control. Currently trading at $79—just beneath the swing low at $80—LTC is also sitting below the monthly open at $82.98. With the bears flexing their dominance, traders are left wondering: Where does the price head next? What’s the target for the bears, and...
ADA’s been stuck in this sideways grind for a while, and the volume’s basically ghosting us. So, where’s it at, and where’s the next move? Let’s dig in. ADA’s sitting at $0.6615 right now, trading below the yearly open at $0.8451 and the range’s sweet spot, the POC, at $0.7325. That tells me it’s leaning a bit bearish, but not exactly screaming panic, more like...
HBAR had an incredible bull run from November 2024 to mid-January 2025, rallying for 74 days and gaining +865%, moving from $0.0416 to a high of $0.40139. However, since then, the market has reversed, entering a 73 day downtrend and dropping -58% from its peak. Now, the big question is: where is HBAR heading next? Let’s break down the key resistance and support...
TIA recently lost its strong $4 support, and that level is now acting as resistance. For the past two months, the price hasn’t been able to climb back above $4, leaving us with one burning question: Is more blood on the table? Broken Support: TIA has given up its $4 support, which now serves as resistance. Looking at November 2024: The low from November 2024...
SUI has been playing nice with the technicals lately, giving us some really neat swing trade opportunities. Remember that short trade we talked about—from $3 down to around $2? Well, here's why that setup was a winner. After that initial short trade, SUI bounced off $2 and then traded in a tight range between $2.5 and $2.2 for about two weeks. Then it broke...


