This is more of an observation-based post rather than a trade setup. It appears that Nifty, in its current bearish trend, is consistently respecting the 50–61.8% Fibonacci retracement zone before continuing downward. We’ve seen multiple pullbacks stall and reverse from this zone — making it a key area to watch. 🔸 If you're looking to short, avoid entering too...
This is a trend continuation setup on Petronet, based on Elliott Wave correction structure, Fibonacci confluence, and price action confirmation. The stock recently completed a clean A-B-C corrective pattern, with Wave C terminating around the 1.382 extension of Wave A — a common Fibonacci exhaustion zone, often signaling the end of corrections. Key factors...
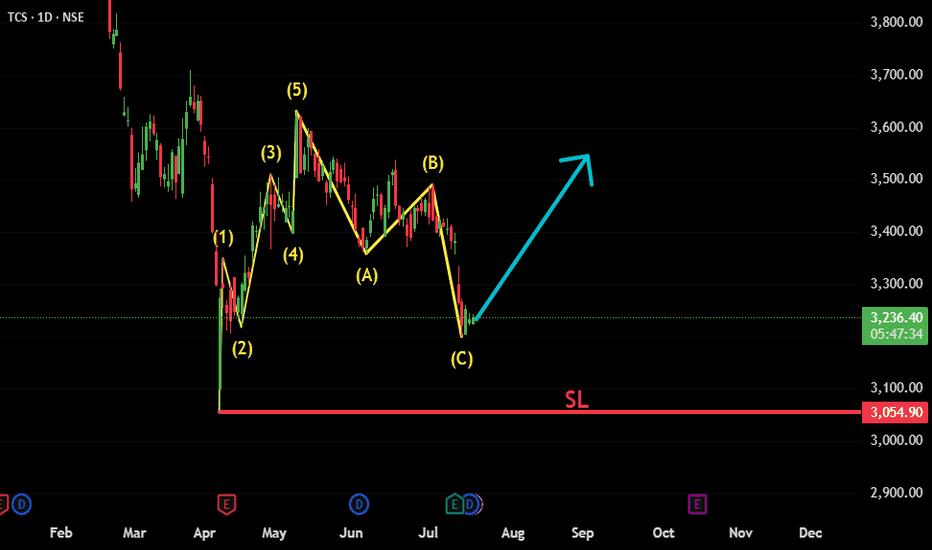
TCS appears to have completed a classic Elliott Wave structure, consisting of an initial 5-wave impulsive move followed by an A-B-C corrective phase. The recent price action suggests the correction has likely ended, and a new bullish impulsive move is beginning. Fundamental trigger: Interestingly, just a few days ago, TCS announced strong quarterly results —...
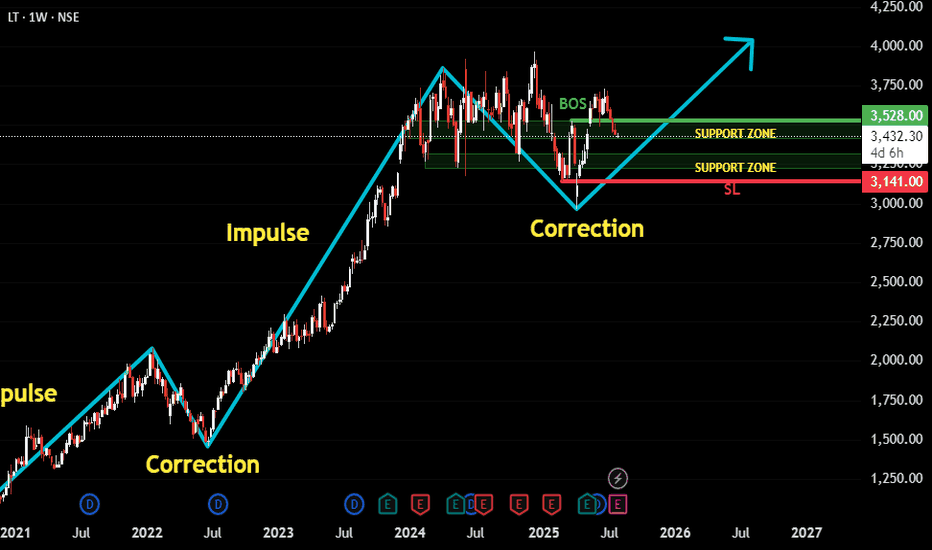
This is a trend-following setup on LT (Larsen & Toubro) where we’ve observed a clear repeating pattern of Impulse → Correction → Impulse. The recent price action suggests that the latest correction has matured, and the structure now hints at a potential next impulse wave beginning. Here’s the thought process behind the setup: ✅ The stock has been trending upward...
A Triangle Pattern has appeared in BajFinance (1) It is an Elliott Wave Patter where we Enter on Break Of B-D Trendline (2) Our Stop is Below the E wave (3) Accuracy of this Pattern is High (4) we Might have Low Risk to Reward Ratio Coz it is a Breakout Pattern But Accuracy Compensates For the Same
Ending Diagonal Pattern Formed on JSW Steel I m Short with SL just above High .... Risk Disclaimer ...it is just for Education Purpose Plz make ur Investment Decisions on ur own risk
I saw a Consolidation and Consecutive Lower Highs and Now a Break of Support level indicating Selling pressure
I think Market is Overbought Right now .... As few days ago there was a huge gap up and market took a resistance finally ... Risky Trade bcz .....Against the TREND .... but at the same time good RISK : REWARD Ratio
Risk Disclaimer - Only for Educational Purpose..... 1) Big Picture trend is good UP 2) I Dropped to Lower Time Frame where Trend was Down And was Looking for Reversals 3) Found Reverse Head & Shoulders Patter.
Short infy with sl above1336 1) Bigger trend Down 2) Divergence Check 3) Small trend losing Momentum
Nifty 50 showing bearishness breakout and retest ....sl can be arnd 18501
Only for educational purpose... Short Position can be taken in ITC.... after a very long matured uptrend.... we can see a Double top Formation .... as going against the trend is risky .... risk must be minimum.... and Stop Loss must be Strict ... Risk to Reward Ratio is very Favourable.....
Just for Educational Purpose.... Ending diagonal Pattern with Double top on its top & Retest to SUPPLY Zone SL must be Strict above high.....
Sail Showing Strong Divergence in Hourly TF Short Position can be taken here with SL around 89.55 Only for Educational Purpose.
Double Bottom formed in SGX nifty..... SL can be kept Around....17298 lvls.... Only for Educational Purpose......
This Analysis is just for Educational Purpose...... Titan is showing Positive Divergence..... Bullish with SL around 2339.90.....
Nifty 50 showing bullish signs.... Also Bigger Picture trend is positive.... Divergence Positive..... SL can be Kept near 17640... Just for Educational Purpose.....
Tata steel got rejected 4 times from that lvls. but right now .... Bullish Engulfing candle shows ..... buyers are intrested .... so if it breaks nowwww ......i m long..... with SL below red zone that will be around 105.9..... Breakout is imp .... Trade at ur own risk ......


