TheAlphaView
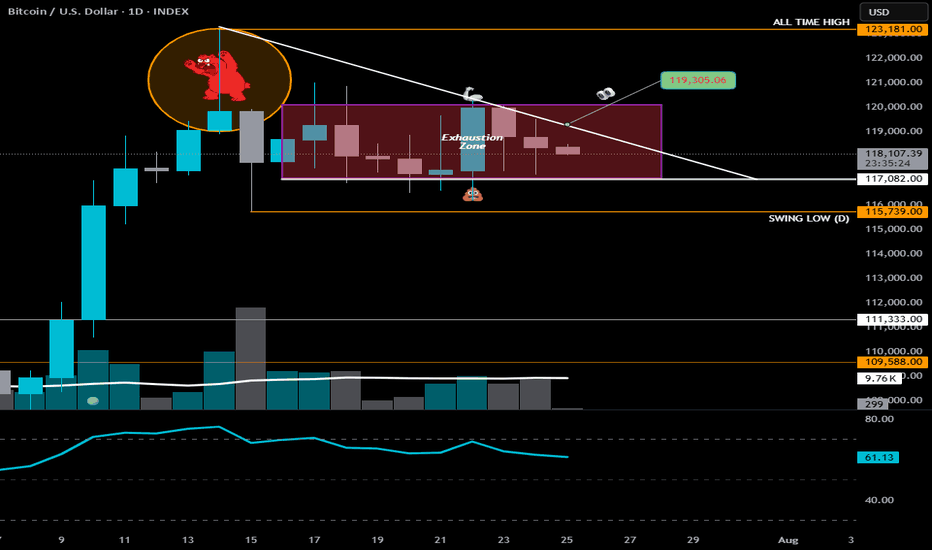
PremiumExhaustion Zone Update: 2025–208 📉 Exhaustion Zone Update: The Bulls Charged… But the Zone Held On Friday, BTC dipped to 114,700, printing a fresh Daily Swing Low — a classic liquidity grab. The bulls stormed in for reinforcements, pushed price back up late in the day… but once again, the Exhaustion Zone stood its ground. BTC closed lower than Thursday, and since...
📍All Eyes on $119,300 Why? Because that’s the line that could break the bearish narrative. A clean push above = bulls showing real strength — not just surviving, but swinging. It might look like BTC is doing nothing… but under the hood, the chart is very much alive. If bulls can’t break the descending trendline, it’s not just hesitation — it’s exhaustion. And...
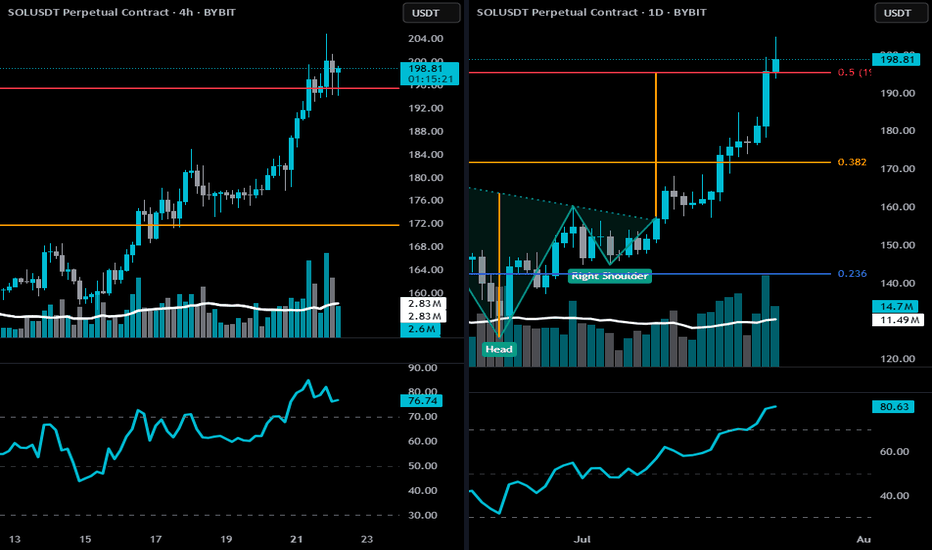
🔻 4-Hour Bearish Thesis 🔸 Price Action Clues SOL is currently stalling at the 0.5 Fibonacci retracement (~$198.18) of the full macro move — a classic profit-taking zone. Multiple upper wicks and indecisive candles at resistance indicate supply absorption and buyer exhaustion. After a steep rally, price is moving sideways in a rising wedge/flag, which is a...
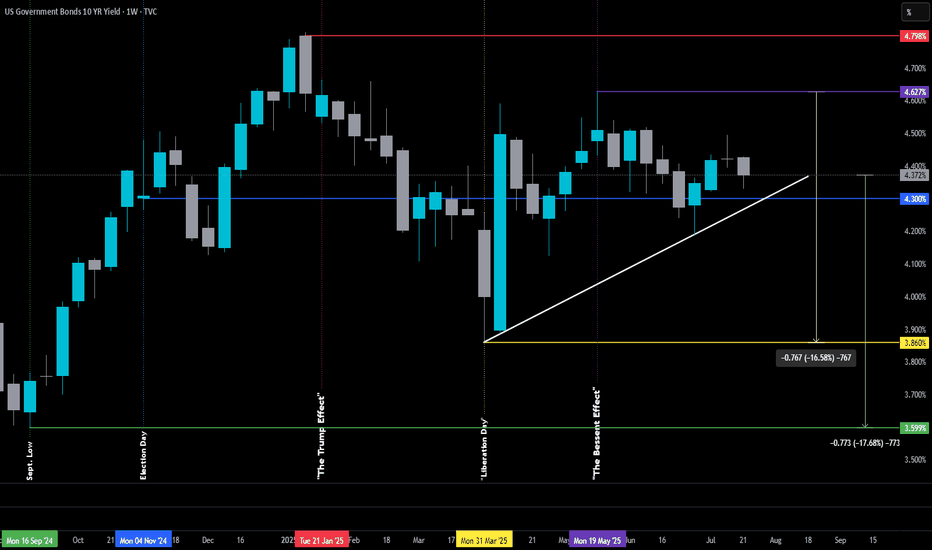
The Bessent Effect: Part I-Challenge the Fed Originally posted on June 30th, 2025, but it was removed by a moderator — I misinterpreted the posting guidelines (I tend to read a little too deep between the lines sometimes). For context, the original version didn’t include the White or Green lines. June 30th post: The 10-year Treasury yield is the heartbeat of...
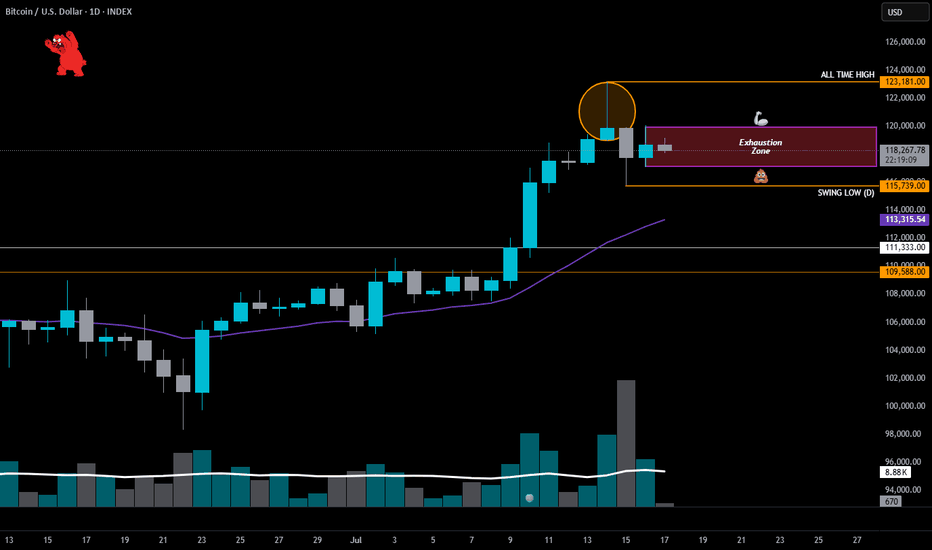
HIGH POWERED SHORT ZONE ⚡️ Usually, a 3% move doesn’t make anyone blink—but this one? It sent BTC into all-time high territory. I almost popped the champagne… until I remembered I’m in a short. Not because I don’t believe in upside—but because my add zone in the HIGH POWERED SHORT ZONE hasn’t been tagged. Yet. Here’s the breakdown...
Upper Wick Rejection Candle 🔶 (Orange Circle) 🔍 Candle Breakdown | July 14, 2025 • Opened near the lows • Rallied intraday to $123K (ATH) • Closed well off the highs, just above $119K • Long upper wick = rejection of higher prices • Elevated volume = signal is valid, not noise 🧠 Translation: Bulls charged into resistance. Sellers didn’t flinch — absorbed the move...
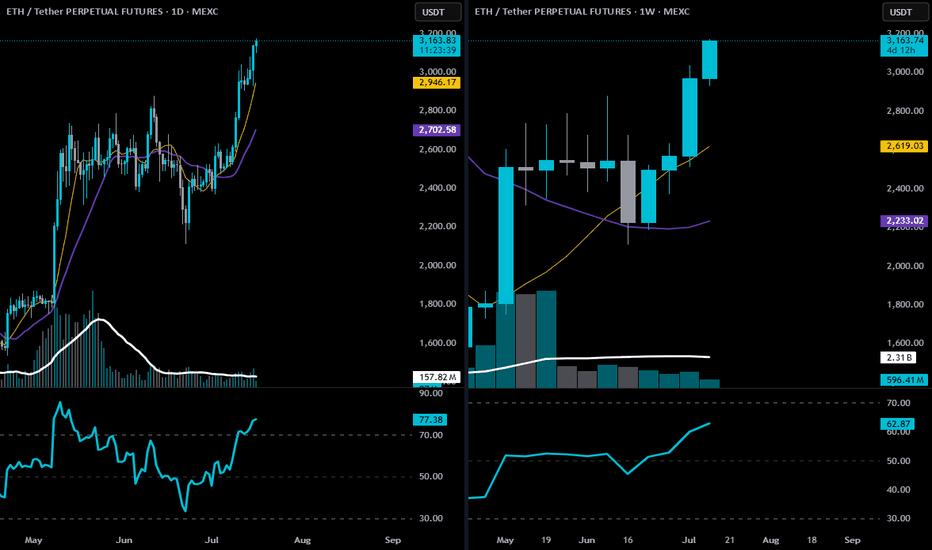
🕐 Daily Chart Analysis Trend: Clear uptrend. Price is trading well above both the 9 EMA (gold) and 20 EMA (purple), with strong angle and separation. Price Action: ETH is pressing into multi-month highs with no major resistance between here and the $3,350–$3,500 range. Volume: Healthy increase in volume on bullish candles; recent bullish expansion looks organic,...
-Update: Originally posted on July 8, 2025… but swiftly vanished into the void by a moderator (rookie mistake—I neglected the sacred posting rules). Turns out, publishing has rules… that I did not interpret accurately? To my loyal circle of 5 followers: if this feels like déjà vu, my sincerest apologies for the rerun. But with the winds shifting and the drums...
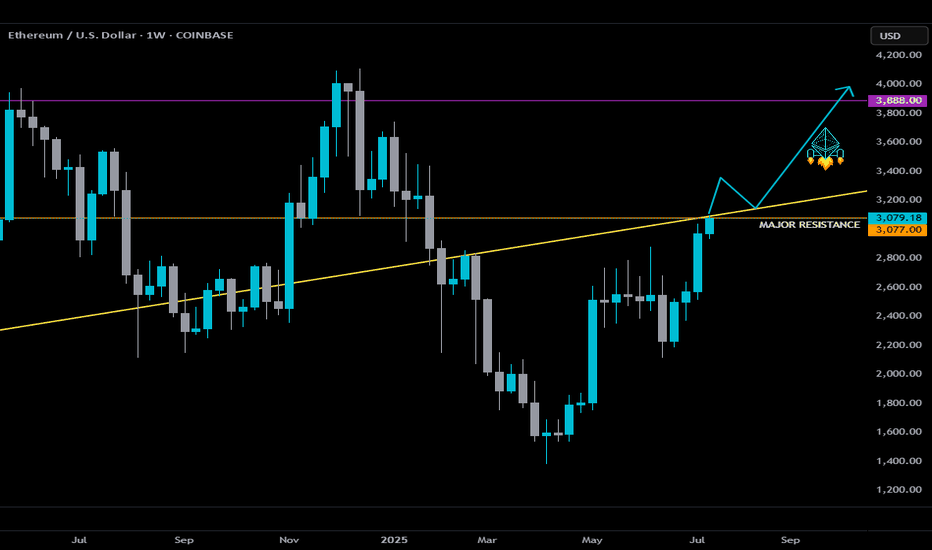
Something BIG is brewing with #Ethereum... 👀 And it’s being quietly triggered by a law almost no one was talking about, till today. A new rally could be closer than you think. Here's the full story 🧵👇 Last month, the U.S. Senate passed the Genius Act — the first serious law aimed at regulating stablecoins. Sounds boring? It's not. Because this act could light...
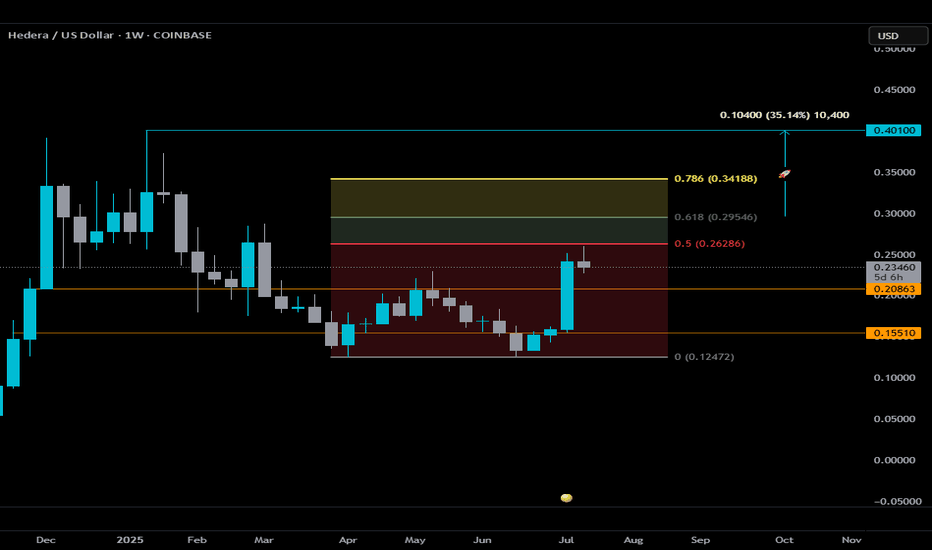
Hedera is attempting to catch some momentum alongside the broader ISO20022 narrative, but from a technical standpoint, here’s what matters right now: 🔍 The 0.5 Fib level at $0.26286 is critical. During last week’s #bUCKmOON the candle came close but ultimately failed to close above it — a clear sign of rejection. Until we see a confirmed weekly close above that...
BTC.D is back at 65% (White Line) — same level we saw 5 years ago (5 years is a natural market cycle). In Dec 2020, it spiked to 73% (Green Line) before dipping hard... and that drop kicked off the last real Altseason. BTC.D dipped to 40% by May 2021 (Orange Line) ETH pumped +470% 🚀 in that window. A few months later in Nov '21, ETH hit its ATH of $4,878 (Pink...


