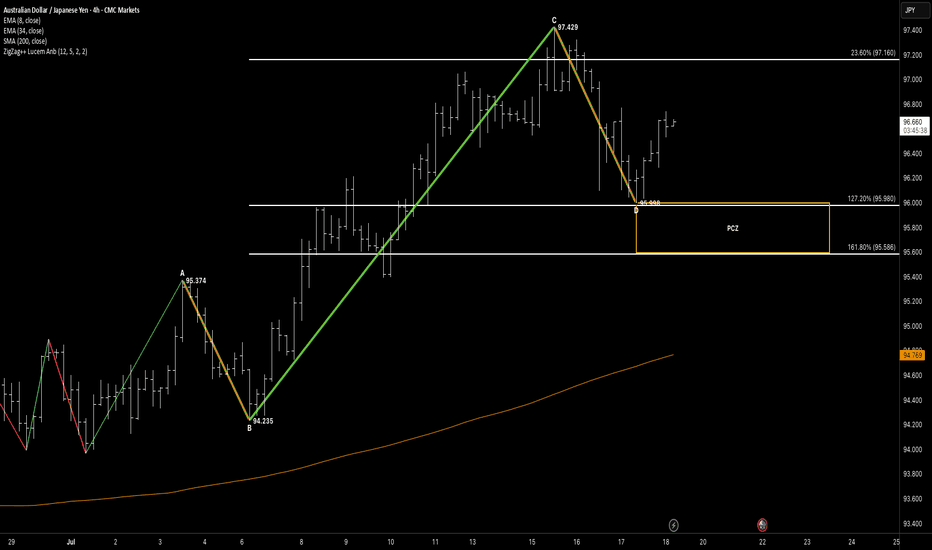
Hello awesome traders! 👋 Hope you’ve managed to grab some solid pips from the markets this week. As we head into the weekend, I’m wrapping things up by dropping a few clean chart setups for you to review and reflect on. Enjoy the weekend, recharge well — and I’ll see you sharp and ready next week for more structure-led opportunities. 📌 Pattern Breakdown We had...
Good morning and good afternoon traders, wherever you're dialed in from. Hope y’all are stacking those pips this week — whether you’re trend-riding, countering swings, or just sitting back letting setups come to you. 🔍 We’ve been hitting precise targets lately, and the tape’s been speaking loud and clear. Doesn’t matter what the sentiment says — we follow price,...
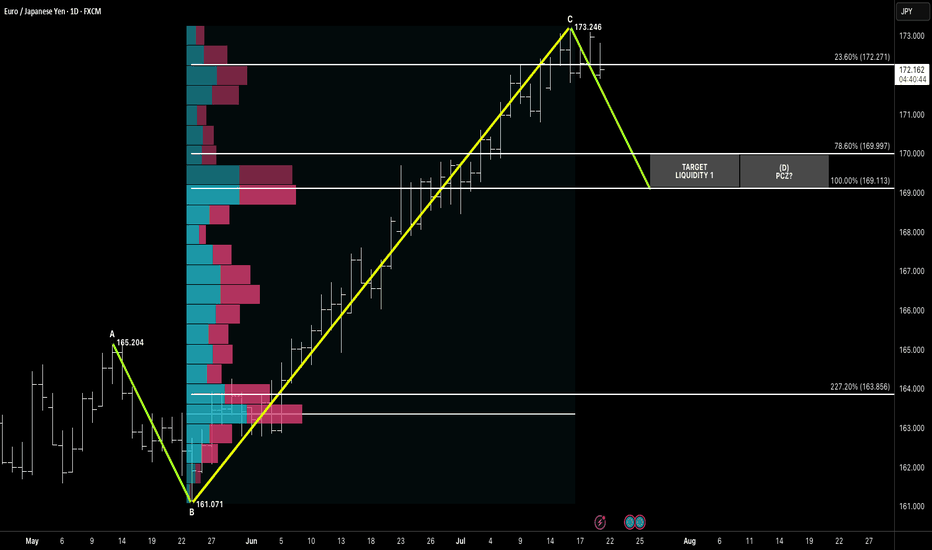
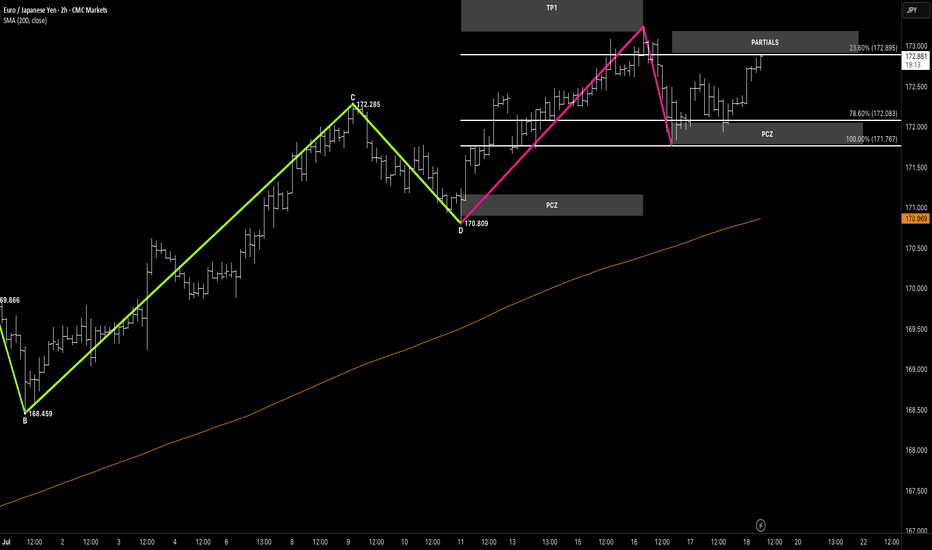
HELLO awesome traders, I hope y'all have had a great weekend!! What a beginning of trading week, ha? lets crack on by droping some chart here for yall. After completing a clean ABC symmetry leg, EURJPY is now showing signs of exhaustion just below 173.250, with price stalling at the high-volume node. The projected Potential Completion Zone (PCZ) aligns at...
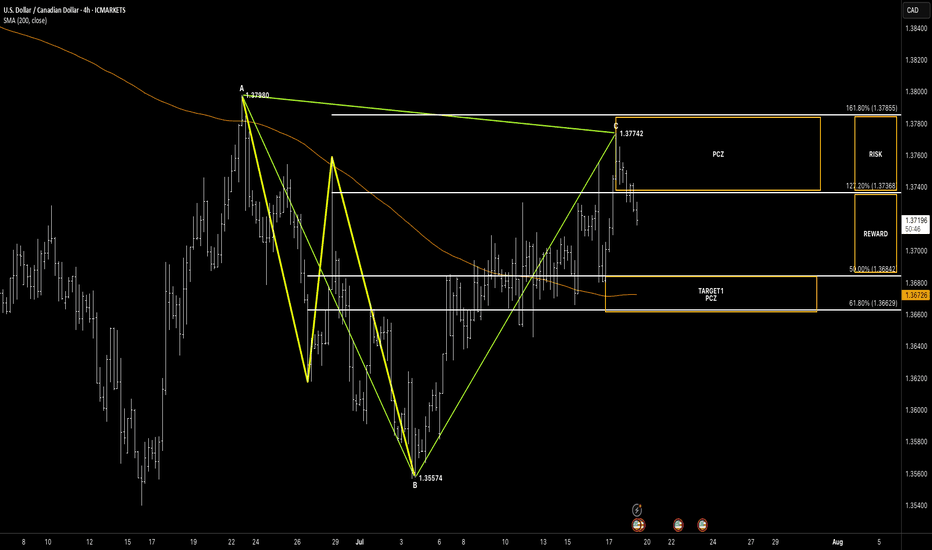
USDCAD / U.S. Dollar – Canadian Dollar (4H) – ABC Bearish Pattern Completion at PCZ Pattern Overview: Pattern Type: ABC Bearish (Potential Reversal) Asset: USDCAD Timeframe: 4H Trade Type: Short Bias – Rejection observed near PCZ zone 🔎 Key Levels XA: 1.37880 → 1.35574 AB: 1.35574 → 1.37742 BC: Completed right into the PCZ, aligning with 127.2% and 161.8%...
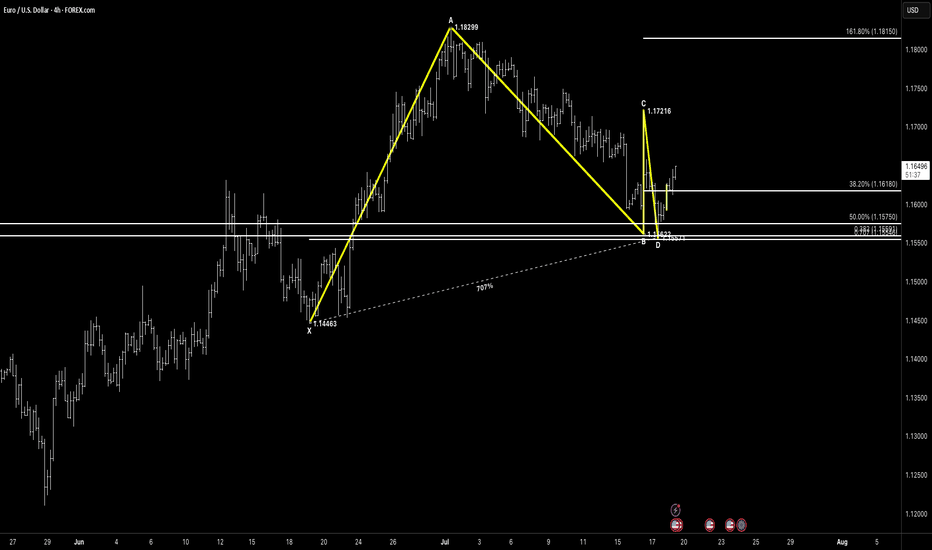
EURUSD / Euro – U.S. Dollar (4H) – ABC Bullish Structure with Double Bottom Base Pattern Overview: Pattern Type: ABC Bullish + Corrective Double Bottom Asset: EURUSD Timeframe: 4H Trade Type: Bullish Bias – Monitoring for continuation after rejection from cluster support 🔎 Key Levels XA: 1.14663 → 1.18299 AB: 1.18299 → 1.16292 BC: 1.16292 → 1.17216 CD:...
USDJPY / U.S. Dollar – Japanese Yen (1D + 1H) – Multi-Timeframe Breakdown Hello awesome traders! 👋 Closing the week with a full top-down look at USDJPY. We’ve got a macro bullish setup developing, but Friday gave us a well-structured intraday bearish opportunity worth studying. Let’s walk through the levels across the timeframes: 🧭 Macro Structure (Daily /...
Hello awesome traders! 👋 Hope you’ve collected some good pips this week — I’m closing out with one more chart for your weekend review. Let’s take a look at this Daily ABC Bullish structure on Cable with precision symmetry and a strong technical reaction. 📌 Pattern Overview 🔹 A beautifully measured ABC Bullish corrective wave unfolding: • A = 1.31392 • B =...
Hello awesome traders! 👋 Wrapping up the week with one more setup review — this one’s moving step by step, and now testing a critical level. Let's break it down. 📌 Pattern Breakdown We had a clean multi-leg impulse and harmonic rotation: 🔹 D-leg reversal formed at 170.809, right inside the PCZ 🔹 Strong rally into the 23.6% fib zone (172.895) 🔹 Partial profits...
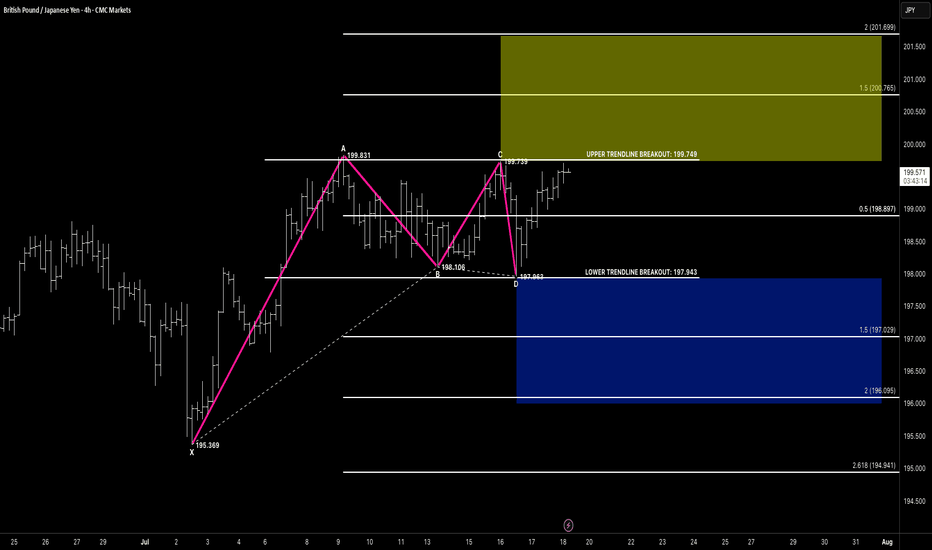
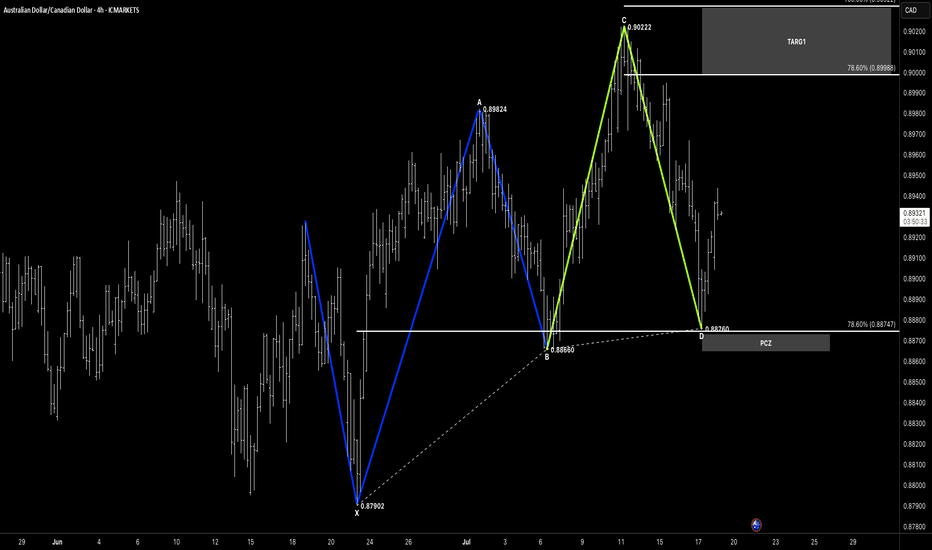
Hello awesome traders! 👋 Hope you’ve managed to grab some solid pips from the markets this week. As we head into the weekend, I’m wrapping things up by dropping a few clean chart setups for you to review and reflect on. Enjoy the weekend, recharge well — and I’ll see you sharp and ready next week for more structure-led opportunities. 📌 Pattern Breakdown We’ve...
Hello awesome traders! 👋 Hope you’ve managed to grab some solid pips from the markets this week. As we head into the weekend, I’m wrapping things up by dropping a few clean chart setups for you to review and reflect on. Enjoy the weekend, recharge well — and I’ll see you sharp and ready next week for more structure-led opportunities. 📌 Pattern Breakdown This...
Hello awesome traders! 👋 Hope you’ve managed to grab some solid pips from the markets this week. As we head into the weekend, I’m wrapping things up by dropping a few clean chart setups for you to review and reflect on. Enjoy the weekend, recharge well — and I’ll see you sharp and ready next week for more structure-led opportunities. 📌 Pattern Breakdown This...
Hello traders! Happy Friday — hope you're closing the week strong. Let’s break down this clean ABC Bearish pattern on EURJPY from the 1H chart. 📍 Structure Breakdown We’re looking at a sharp A to B decline followed by a corrective rally into point C. Point C completes just under the previous swing high, creating a potential lower high setup. Price has reacted...
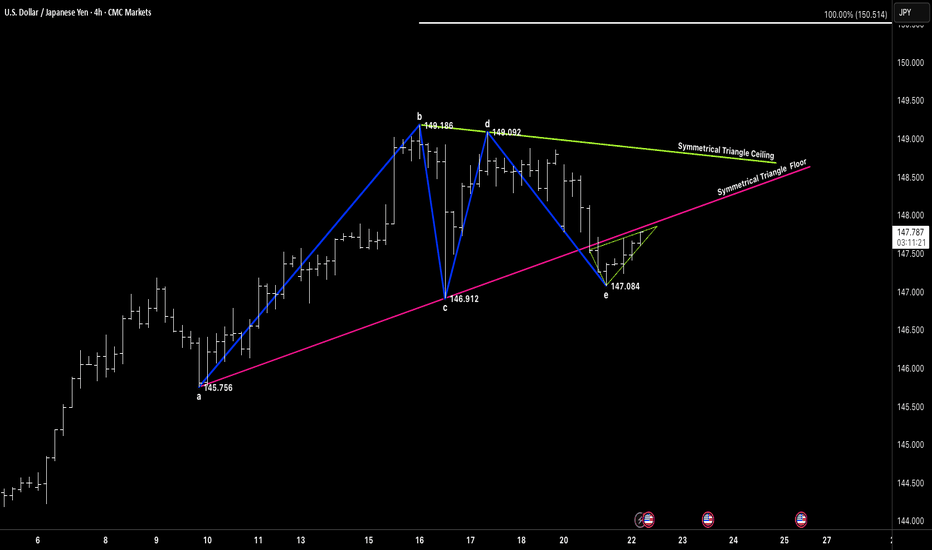
Hello traders! I hope you’ve had a productive trading week. Let’s take a look at USDJPY, where we’re wrapping up the week with a textbook XABCD Double Top formation. 📍 Structure Overview Price action completed an extended XABCD formation, with D printing a perfect double top around the 147.17 level. The move from C to D aligns closely with the prior XA leg,...
Hello traders! 👋 Hope you're all having a strong and focused week in the markets. Let’s take a moment to walk through this beautifully structured 5-leg wedge formation on EURUSD. 📌 Pattern Breakdown We’ve just seen a clean completion of a 1-2-3-4-5 descending wedge sequence — each leg clearly defined and well-behaved within structure: 🔹 Wave 1 to 5 forms a...
Hello traders! 👋 I hope you’re having a fantastic trading week so far. Let’s take a look at the USDJPY setup unfolding right now — and it’s all about classic symmetry. 📌 Setup Breakdown We’re seeing a textbook ABC Bearish Continuation: 🔹 AB: Sharp move down 🔹 BC: Clean correction back into structure 🔹 CD (Projected): Symmetrical to AB, aiming toward the target...
CHFJPY has formed a C&H pattern on its weekly chart. The price is trading above the Breakout: 149.799. ST: 143.377 Targets: 62%: 179.736 79%: 87.879 100%: 197.640
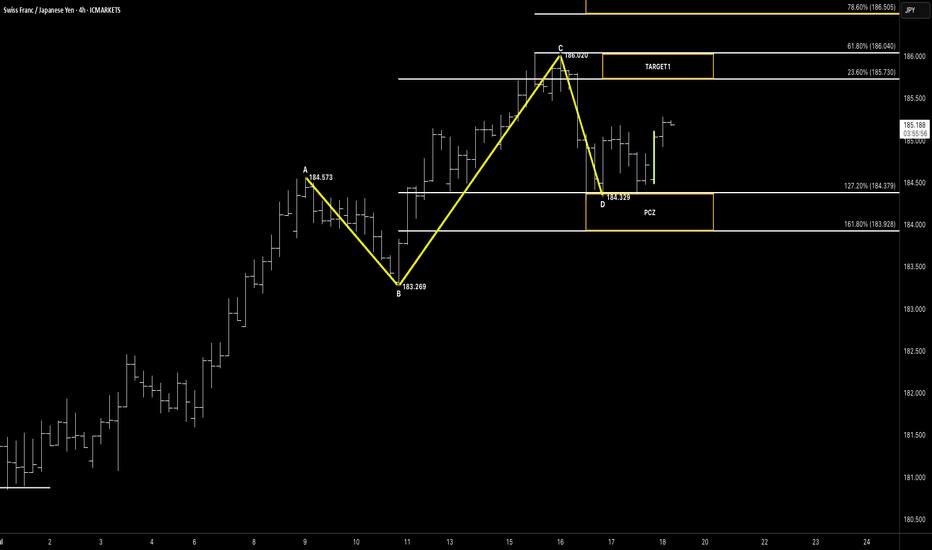
Hello awesome traders! 👑✨ I hope you’ve had an amazing weekend and are ready to kick in the trading week like a pro. Let’s dive straight into the CHFJPY chart — and it’s shaping up to be a high-probability opportunity to start the week strong. 🧠 Setup Breakdown: Price has formed a clean 121 bullish reversal — a classic pattern built on symmetry, structure, and...
Hey traders, hope you’re having a solid week! 🚀 Spotted a classic XABCD Bearish setup on the EUR/USD 2-Hour—price is trading below the PCZ and just formed a corrective double-top at 1.17298, setting us up for a potential continuation lower. 🧠 What’s Going On? X→A (Down): 1.18306 → 1.17472 A→B (Up): 1.17472 → 1.18103 B→C (Down): 1.18103 → 1.16870 C→D (Up):...
