Traders_Notes
DODO is a decentralized finance (#DeFi) protocol that has seen a brutal 99% drawdown from its peak — making it one of the most devalued tokens in the market. 📉 Structure: The chart shows a “channel within a channel” structure — a signal of prolonged capitulation. DODO is currently in a range where most have written it off. But history shows that such zones often...
The price has been moving sideways for several months, forming a classic low-volatility summer channel. 🔹 Primary trend: still bearish — price remains inside a descending channel 🔹 Volume: mostly low, but occasional spikes near support may signal hidden accumulation 🔹 Formation: a triangle is forming near the top of the channel — false breakouts or wicks are...
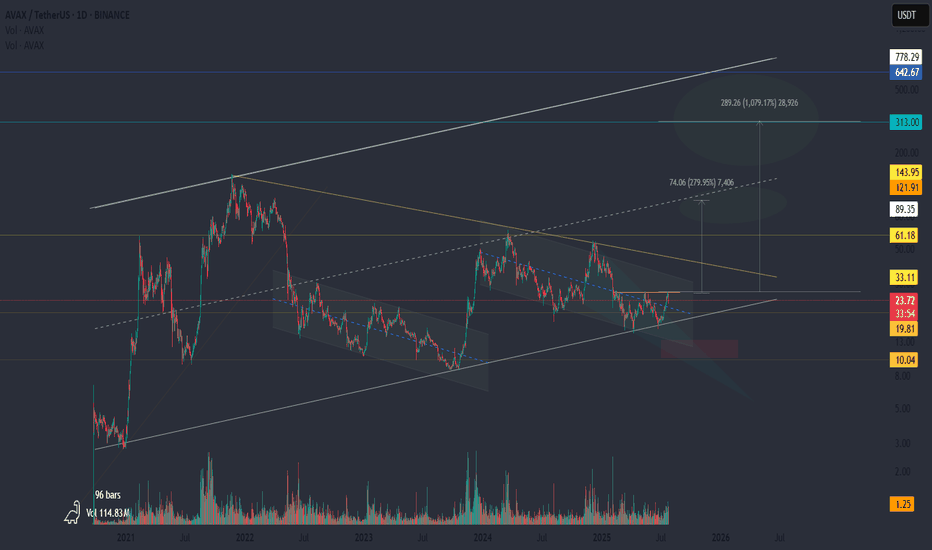
This might be the calm before the cycle. 📍 All the liquidity is above. Levels like 33 and 61 aren’t just resistance — they’re fuel. Clusters of short liquidations and forgotten limit orders are sitting right there. If we get a breakout, it could be sharp. And if there’s another pullback? Don’t panic. That would be the test — the shakeout before the move. 🚀 If...
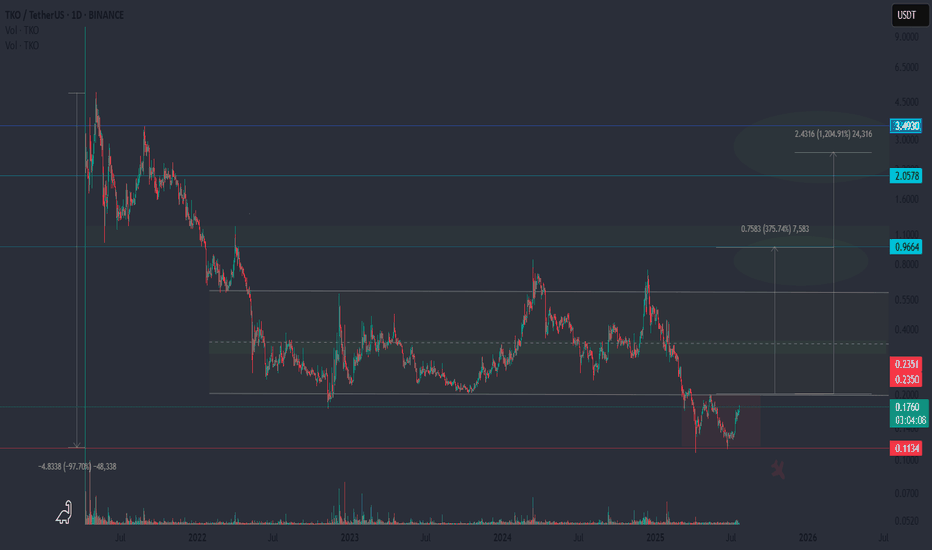
💀 This is beyond a correction — it's a total wipeout. Down 97% from the highs. What looked like a solid accumulation zone? Crushed. Stop-loss hunters had a feast — anyone still holding got flushed out. Now the price is trapped below the former floor — a channel under the channel, the basement of the market. Below that? A void. A drop into the unknown. Yes,...
Secondary Trend (Recovery Phase After Capitulation) After a long accumulation phase at the bottom, the price made a strong impulsive move upward with growing volume. This created a classic “Cup and Handle” formation, where the initial surge was stopped by major resistance near the cup's rim. Currently, the price is finalizing the handle and may be preparing for a...
📉 Technical Overview: WAXP continues to move within a well-defined downward channel, with the price having dropped by roughly 98% from its peak. Currently, it's forming a falling wedge pattern, and the price is approaching the upper boundary — often a zone of breakout potential. 💡 Key Point: We’re seeing notable buying volume, which could suggest accumulation by...
📉 Technical overview: SPELL has gone through a dramatic decline since launch, but the chart reveals a consistent pattern: long accumulation phases in a descending wedge formation, followed by sharp upward impulses. Currently, the price is once again consolidating near the same zone where previous breakouts occurred. The structure resembles past setups, which...
The chart shows a clear key area — a “core zone” that keeps attracting price action. Price reacts to it repeatedly — sometimes bouncing from below, sometimes rejecting from above. Now we’re seeing another retest with potential upside. 🟡 Trading near the mid-range is the simplest approach. Entry from the current level is possible, but there’s still a chance of...
Lido Finance is a major decentralized liquid staking protocol. It allows users to lock ETH and receive stETH, which can then be used across various DeFi platforms. 🔍 Technical setup: ▪️ Price is moving inside a broad horizontal range with wicks in both directions ▪️ Within that, there’s a secondary descending channel ▪️ Currently forming a potential double bottom...
APT/USDT is showing a repeating cyclical structure — three times price has broken out of a falling wedge, each followed by a sharp rally. 📈 Historically: ▪️ Each breakout led to +150% or more gains ▪️ We’re now seeing a third similar setup forming ▪️ Targets (based on previous expansions): 8.18 / 14.44 / 31.138 📉 What if price dips again? ▪️ A pullback toward the...
Price has dropped over –96% from its peak — a typical altcoin story: the project is forgotten, but technically still alive. The line between a bottom and a total collapse is thin here, yet the structure remains intact for now. 🔻 Technical Outlook: ▪️ Price is moving within a descending channel ▪️ The recent inverted head and shoulders pattern failed to play...
📊 Technical Overview: TON/USDT is forming a descending wedge on the daily chart and holding above a strong support zone between 2.75–2.85 USDT. This area may act as an accumulation zone before a potential mid-term breakout. 🔻 Below the current range is a possible liquidity sweep zone around 1.80–2.10 USDT (marked in red on the chart). If price dips into this...
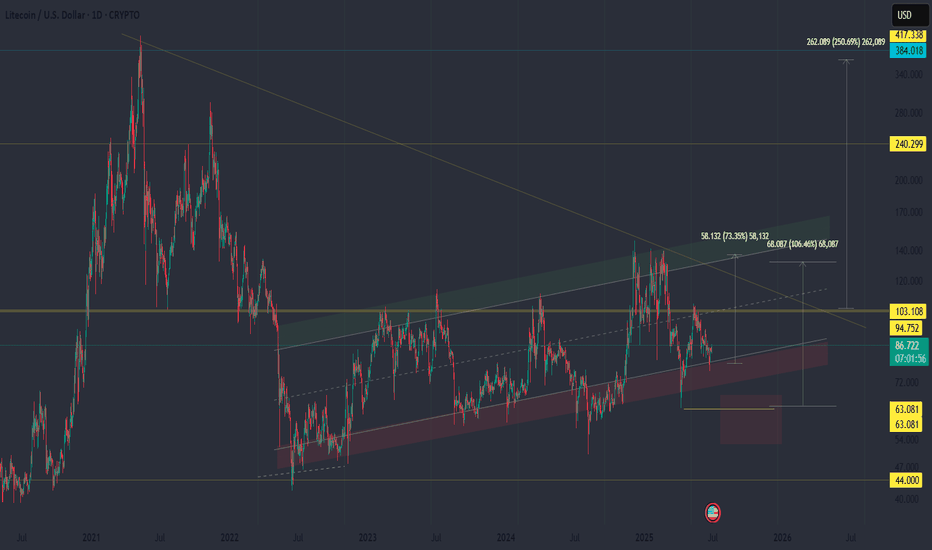
📊 Technical Overview: Litecoin is forming a potential reversal structure near a key long-term support zone. Historically, this area acted as an accumulation range before significant upward moves. The price is still holding within a broad ascending channel, and current consolidation may represent the final stage before a breakout. 🔻 Below lies a potential liquidity...
🧠 Context: Another chart showing a typical altcoin structure near the bottom. Price has dropped over 98% from the all-time high. The concept of a "bottom" here is highly abstract — risk remains elevated, and liquidity is thin. 📉 Chart Highlights: ▪️ Price is still moving within a descending channel ▪️ A potential double bottom or dragon pattern is forming ▪️ The...
🔹 Over 600K followers on Twitter — strong social presence – Listed on Coinbase, which adds major credibility – Down more than -99% from ATH 🔍 Technical Overview: – Classic altcoin structure: channel breakdown → sideways consolidation → renewed drop into capitulation zone – Currently forming a falling wedge, with a possible double bottom – If no bounce — further...
📍 The chart is forming a Livermore-style expanding wedge — a structure where each price swing grows wider, and volatility increases. 📌 The current zone may be a key turning point for the trend.
🧠 Context: ▪️ A "cup and handle" formation is developing — a classic bullish continuation structure. ▪️ Price is consolidating just below the upper channel resistance, forming a local bull flag. ▪️ ENS may follow ETH’s movement — or even outperform — due to its lower liquidity, offering potentially greater upside. 📌 Key Notes: ▪️ A breakout and hold above the...
📉 Overview: BabyDoge has been trading within a wide horizontal range for nearly two years, showing classic accumulation and distribution behavior. Support zone: ~0.0000000010 Resistance zone: ~0.0000000030–0.0000000035 Current price: ~0.00000000139, sitting near the lower boundary of the range — a historically significant demand area. 🔁 Pattern Repetition: This...


