TuffyBro
Premium* **Blue Zone** = Minor bullish support or reaction zone * **Yellow Zone** = Major bullish order block / demand zone * **Red Zone** = Bearish supply zone or resistance --- ### 🧠 **Scenario Planning:** #### ✅ If price **holds above the blue zone**: * Expect a **bullish continuation** * Target: **Red zone** (potential resistance or reversal area) * Could be a...
CUGHT 85% MOVE now it looks like it will drop short with tight sl
we did an amzing long and gained good profit now looking for a short and a breakout for long posted next moves
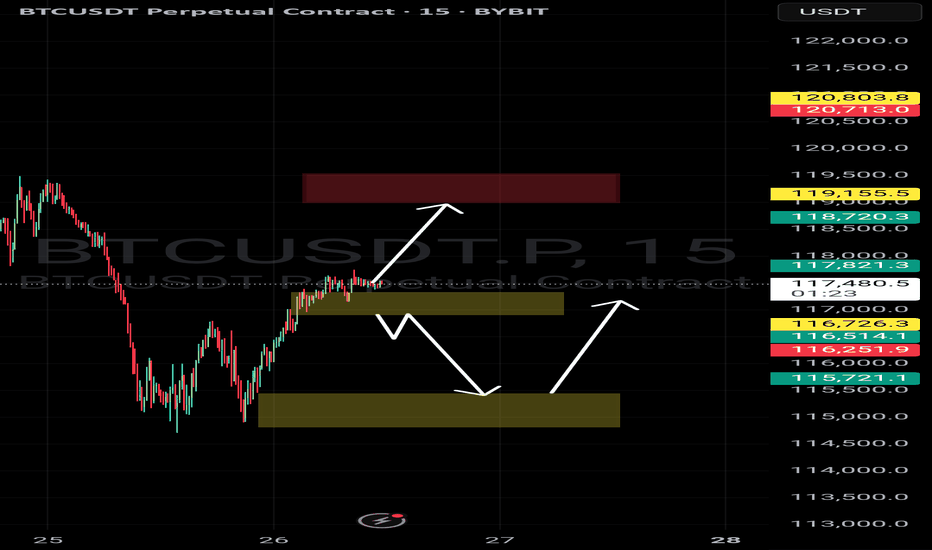
We can see btc hovering over bullish ob We can expect a pump from here If breakdown both bullish ob we can look for shorts Indicator used tuffycalls smc orderblock
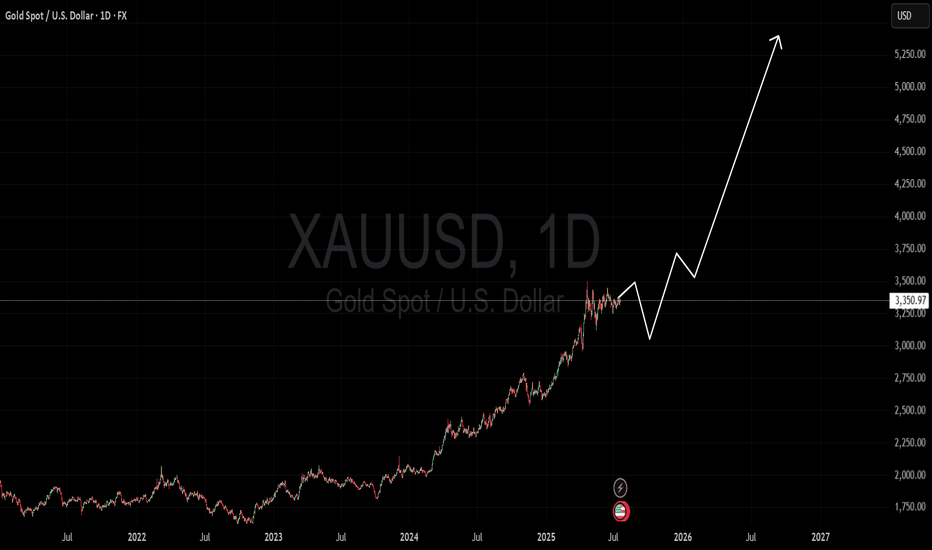
## 🧠 **Fundamental Analysis of GOLD (XAU/USD)** Gold remains one of the **most reliable stores of value**, especially in uncertain macroeconomic conditions. ### 🔥 Key Drivers Supporting a Long-Term Bullish Case: 1. **Global Debt Crisis & Currency Devaluation** * Central banks worldwide are printing money to manage debt, inflating fiat currencies. *...
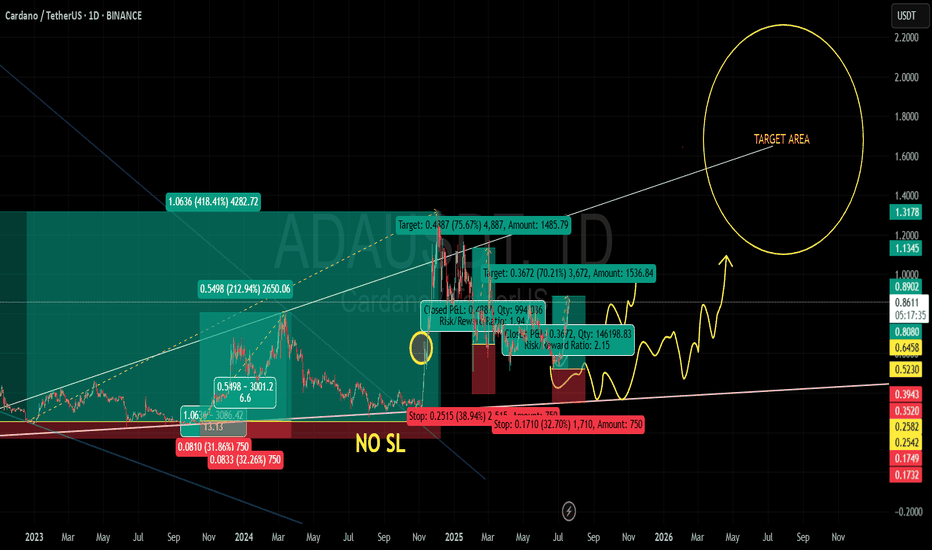
✅ Profitable Trades Counted (Spot Swing): 418% 213% 75% 70% 💰 Approximate Cumulative Gain (Compounded Not Calculated) = 776%+ gain from multiple swing trades 🧠 Your POV (as seen on chart) “NO SL” indicates confidence in ADA’s long-term support zones. trusted strong support accumulation areas (red zone) and rode through volatility. Strong belief in...
im in short already but looks like it will drop more because it broke down trend line
🚨 DEEPUSDT BREAKOUT ALERT 🚨 🔥 Price has broken the long-term downtrend on the 1D chart 🟢 Retesting the trendline near 0.182 📈 If it holds — we may see a strong pump ahead! Chart shows strong momentum — watch for retest and ride the wave 🌊 — TuffyCalls Team ✅
### 🔴 **Bearish Order Blocks (Resistance Zones)**: These are likely areas where price previously faced selling pressure and may again. 1. **Zone 1 (Lowest Red OB)** 📍 Range: \~108,300 – 108,800 🔹 Price is currently reacting at this zone. 🔹 If price fails to break and close above this zone with volume, expect a short-term rejection. 2. **Zone 2** 📍...
🧠 Scenarios: 1️⃣ Break above $149.50 → Possible push to $154–161 2️⃣ Rejection from red zone → Drop toward $132 3️⃣ Dip to $126–132 → Bullish recovery expected 📊 Plan your entries with structure & confirmation. No chasing.
Mastering Zones: Your Quick Trading Guide! Remember the core logic: 🔵 Blue Zone: PUMPS FROM BLUE (Look for buys!) DUMPS IF BREAKS BLUE (Consider sells/exit longs!) 🔴 Red Zone: DUMPS FROM RED (Look for sells!) PUMPS IF BREAKS RED (Consider buys/enter longs!)
INJ Long 📦 Entry Zone: $11.63 (Marked on chart) 🎯 TP1: $12.11 (Based on the white line) 🎯 TP2: $13.75 ❌ SL: $10.74 🧠 Strategy: ✅ Use low leverage ✅ Risk only 2–5% per trade ⚠️ Stick to the plan — no chasing trades. Discipline = Consistency 💹 TuffyCalls Team
Last time we had great btc trade This time play this boxes with good risk management
### 🔍 Breakdown of Chart: * Timeframe: 15m BTCUSDT (Bybit) * Current Trend: Sharp downtrend from the recent highs * Zone Marked in Blue: Bullish Order Block / Demand Zone * Yellow Path: Anticipated reclaim and reversal scenario * White Curve: Possible double bottom (liquidity sweep) --- ### ✅ Why Long Plan Makes Sense: 1. Demand Zone (Blue Block): This zone...
Made good money from last trades now play new boxes **Mastering Zones: Your Quick Trading Guide!** Remember the core logic: * **🔵 Blue Zone:** * **PUMPS FROM BLUE** (Look for buys!) * **DUMPS IF BREAKS BLUE** (Consider sells/exit longs!) * **🔴 Red Zone:** * **DUMPS FROM RED** (Look for sells!) * **PUMPS IF BREAKS RED** (Consider buys/enter...
OKX:MOODENGUSDT : Zone Test! 🚀📉 Price challenging our 🔴 Red Zone DUMPS FROM RED PUMPS IF BREAKS RED! (Breakout potential!) Our 🔵 Blue Zone (0.1505-0.154) is next support. PUMPS FROM BLUE (Rebound spot!). DUMPS IF BREAKS BLUE! (Warning!) Watch this closely!
The chart shows **ETH/USD (Ethereum to USD)** on the **4H timeframe**, forming a **rising channel** pattern. Here's a breakdown of the analysis: --- ### 🔍 **Pattern Identified** * **Rising Channel** (also known as an ascending channel): * **Upper Resistance Line:** Price is currently testing this line. * **Lower Support Line:** Held multiple times,...
XLMUSDT Long 📦 Entry Zone: $0.28025 (Marked on chart) 🎯 TP1:0.28841 🎯 TP2:0.3068 ❌ SL: $0.26751 🧠 Strategy: ✅ Use low leverage ✅ Risk only 2–5% per trade ⚠️ Stick to the plan — no chasing trades. Discipline = Consistency 💹 TuffyCalls Team


