#ENS ZON LONG : 1) 15$ 2) 13$ Target : 1) 39$ 2) 53$ 3) 66$ ST : 8$
#SUI ZON LONG : 1) 2.3$ 2) 2.1$ Target : 1) 3.9$ 2) 4.6$ 3) 5.5$ ST : 1.5$
The price has bounced strongly from the demand zone between $270 – $295, suggesting the start of a potential bullish wave. A falling wedge pattern has been broken to the upside on the weekly timeframe, which is a strong bullish signal. Buy Zone: Support zone between $270 – $295 offers a solid buying opportunity if retested. Targets: Target 1: $491 Target 2:...
🚀 CRYPTOCAP:PEPE is waking up from the floor! Fibonacci Confluence Zone held strong around 0.00000507, showing accumulation at historical support. Price broke out of a multi-month downtrend and is starting to show bullish structure. Momentum building with weekly bullish candles and reclaiming key levels. 🎯 Targets: • 0.00002072 • 0.00002789
#AVA is showing renewed strength after multiple weeks of downside. If momentum continues and the breakout confirms, AVA may rally over +300% from current levels based on the structure shown Strong bounce from a key weekly support zone. Formed a bullish engulfing candle after extended consolidation near the bottom. Descending wedge pattern potentially...
#SOL ZON LONG : 1) 140$ 2) 124$ Target : 1) 171$ 2) 217$ 3) 268$ ST : 70$
LSE:CRV broke out of a bullish wedge and bounced perfectly from the $0.45 support zone Next targets: 🎯 $0.8991 🎯 $1.3283 Structure still favors upside 🚀
📉 Trend Structure: Price was in a downtrend within a falling wedge structure. A breakout has occurred, followed by a retest of the wedge and price currently moving toward a buy zone aligned with Fibonacci retracement levels. 📊 FIB Buy Zone: Strong support area located between the 0.618 and 0.786 Fibonacci levels. This zone is highlighted as a potential long...
Price is reacting strongly from a key demand zone and has broken out of a bullish wedge. As long as price holds above the breakout zone ($0.005), there is strong potential for a continued move to the upside toward the outlined targets. 🔹 Current Price: $0.0055 🔹 Key Demand Zone: $0.0034 – $0.0046 Price has been in a strong downtrend within a falling wedge...
Price is moving within a descending channel and currently testing the bottom trendline, which has acted as a strong support historically. A rounded bottom pattern is forming inside the channel, suggesting a possible accumulation phase before breakout. Break above $2.00–$2.20 resistance could signal the beginning of a bullish wave toward higher levels. This...
Weekly support is holding firm around $74K, offering a strong risk/reward entry area. Bitcoin is forming a bullish continuation structure on the weekly chart. If confirmed with a close above $80,000, it could ignite a rally toward six-figure territory. Ideal for long-term swing positions or portfolio stacking. 🔹 Entry Zone: $74,000 – $78,000 📉 Stop Loss:...
Triple bottom structure on the weekly timeframe indicating strong demand. Historical moves from this support zone have produced +200% rallies. Current PA shows a rounded retest with a bullish setup forming — similar trajectory expected. Break of $4.60 will be the first key confirmation for acceleration upward. ✅ Entry Zone: $3.70 – $4.20 📍 Current Price:...
✅ Entry Zone: $3.00 – $3.30 📍 Current Price: ~$3.30 🎯 Targets: • T1: $4.515 • T2: $6.038 • T3: $7.857 🔻 Stop Loss: $2.60 🔍 Technical Breakdown: Price action shows reversal signs after a sharp drop into a weekly support block. Structure suggests a potential double bottom with bullish engulfing confirmation forming. Clean breakout above $3.60 would validate...
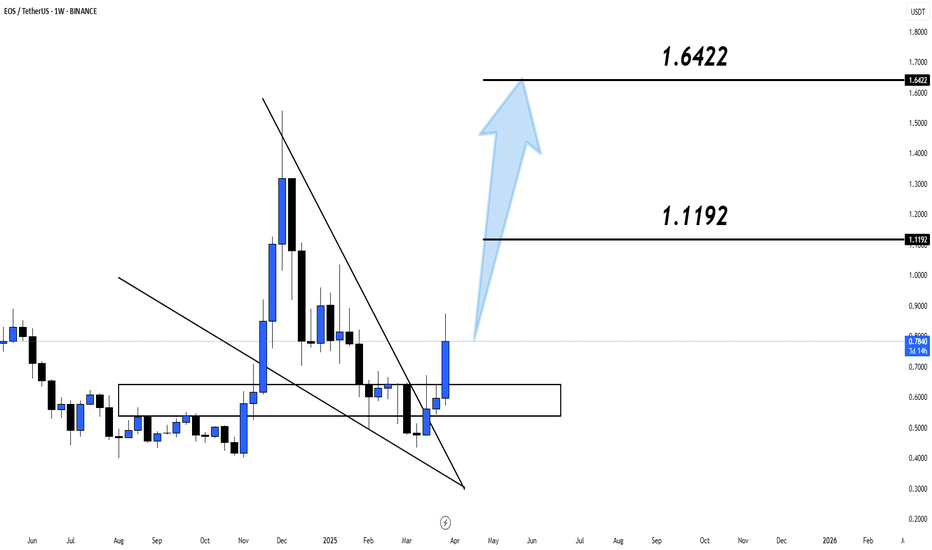
✅ Entry Zone: $0.70 – $0.78 🎯 Targets: • T1: $1.12 • T2: $1.64 🔻 Stop Loss: $0.62 🔍 Technical Insight: EOS has broken out of a descending wedge pattern and successfully reclaimed a major support-turned-resistance zone. The bullish engulfing candle on the weekly timeframe confirms momentum shift. If price sustains above the breakout zone, we may see a strong...
✅ Entry Zone: $2.00 – $2.20 🎯 Targets: • T1: $3.36 • T2: $3.96 • T3: $4.69 🔻 Stop Loss: $1.85 🔍 Technical Insight: XRP is testing a strong weekly support zone, forming a potential reversal structure. The descending wedge appears to be nearing its apex, hinting at a bullish breakout. Fibonacci retracement levels align with the support area, further confirming a...
Toncoin is showing a strong bullish reaction from a historical demand zone that has acted as both resistance and support multiple times in the past (highlighted with red circles). This level continues to prove its significance. Currently, #TON has bounced off the lower boundary of a falling channel, suggesting a potential reversal setup. ✅Retesting major...
CRYPTOCAP:LINK is trading within a clear rising wedge structure and has just bounced from the 0.786 Fibonacci level ($13.55) — a historically strong retracement zone. This bounce aligns perfectly with the lower trendline support, suggesting a potential continuation to the upside. If this trend holds, we may witness a strong bullish leg ahead. Bullish...
Bittensor, one of the top projects in the AI & DePIN sectors, is currently accumulating above the key zone while still trading below the ATH resistance 🧐 Trend: Bullish reversal in sight Accumulation: Price is currently at the lower trendline of the falling wedge, indicating a strong buying opportunity. 📌 Best strategy? This is a good opportunity to load a...


