WavePoint_FX
PremiumElliott Wave Analysis – XAUUSD August 10, 2025 1. Momentum Analysis • D1 Timeframe: Daily momentum lines are still overlapping without a confirmed reversal signal. This suggests that a potential reversal could occur within the next 1–2 days. • H4 Timeframe: Momentum is currently rising, indicating that prices may continue to climb during the Asian session...
📊 🔍 Momentum • D1 Timeframe: Daily momentum is currently turning down, limiting the potential for a long-term rally in the current bullish wave. This also suggests that the top may already have formed around the 3,409 level. • H4 Timeframe: Momentum is still declining and needs about one more H4 candle to reverse upward. For now, the downward move is likely to...
📊 ________________________________________ 🔍 Momentum Analysis: • D1 Timeframe: Daily momentum is turning bearish, signaling that a medium-term downtrend may have already started and could last until mid-next week. • H4 Timeframe: Momentum is rising, but the slope of the two momentum lines is relatively flat → indicating weak bullish strength. We should closely...
📊 ________________________________________ 🔍 Momentum Analysis • D1 Timeframe: Daily momentum is showing signs of a potential bearish reversal. However, we need to wait for today’s candle to close to confirm the signal. While waiting for confirmation, price may still experience a minor upward move on lower timeframes, but the current bullish momentum is weak and...
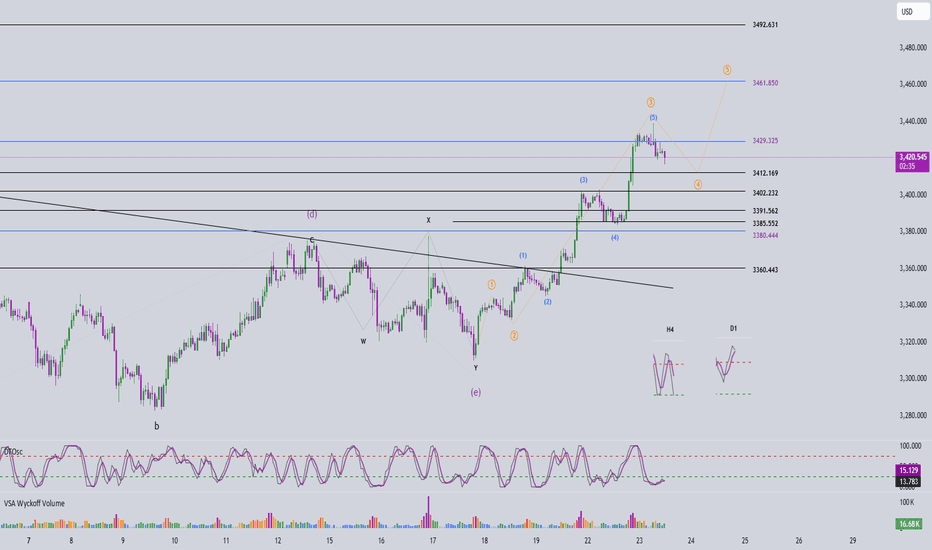
📊 ________________________________________ 🔍 Momentum Analysis: • D1 Timeframe: Momentum has entered the overbought zone. As anticipated in previous plans, we've seen four consecutive bullish days, and the current overbought condition signals that bullish momentum is weakening. • H4 Timeframe: Momentum is reversing downward → We expect a potential pullback today,...
📊 🔍 Momentum Analysis: D1 Timeframe: Momentum continues to rise strongly. It's expected that the price will keep rising for at least two more trading days, pushing the momentum indicator into the overbought territory, reinforcing the current bullish trend. H4 Timeframe: Momentum is showing signs of a potential bearish reversal, indicating a possible corrective...
📊 ________________________________________ 🔍 Momentum Analysis: • D1 Timeframe: Momentum has reversed to the upside. Based on this signal, we expect a bullish trend to continue for the next 5 daily candles — likely until mid-next week. • H4 Timeframe: Momentum has also turned upward → This suggests that from now until the U.S. session, the price will likely...
📊 🔍 Momentum Analysis • D1 Timeframe: Momentum has started to reverse upward, but we need to wait for today’s daily candle to close for confirmation. Until then, there is still a risk of another short-term decline. • H4 Timeframe: Momentum lines are clustering in the overbought zone, signaling a possible weakening of the current upward move. However, this signal...
📊 ________________________________________ 🔍 Momentum Analysis: • D1 Timeframe: Momentum has entered the oversold zone. This strongly suggests a potential bullish reversal today, which could lead to a rally or sideways movement lasting around 4–5 days. • H4 Timeframe: Momentum is reversing upward. This indicates a likely bullish or sideways move in the short...
📊 ________________________________________ 🔍 Momentum Analysis • D1 Timeframe: Momentum is declining. Based on the current pace, it’s likely that only 1–2 more daily candles are needed before momentum enters the oversold zone → suggesting one more potential downward leg. • H4 Timeframe: Momentum is about to turn bearish, indicating we might see a sideways...
📊 ________________________________________ 🔍 Momentum Analysis: • D1 Timeframe: Momentum is currently in a downtrend, indicating that the dominant trend in the short term (at least until early next week) is likely to remain bearish or sideways. • H4 Timeframe: Momentum has entered the oversold zone and is showing signs of a potential bullish reversal. This...
________________________________________ 🔍 Momentum Analysis: • D1 Timeframe: Daily momentum is showing signs of a potential bearish reversal. We need to wait for today’s daily candle to close to confirm this. It signals that the bullish momentum is weakening. • H4 Timeframe: Momentum is turning down. It may take around 2 more bearish H4 candles to push momentum...
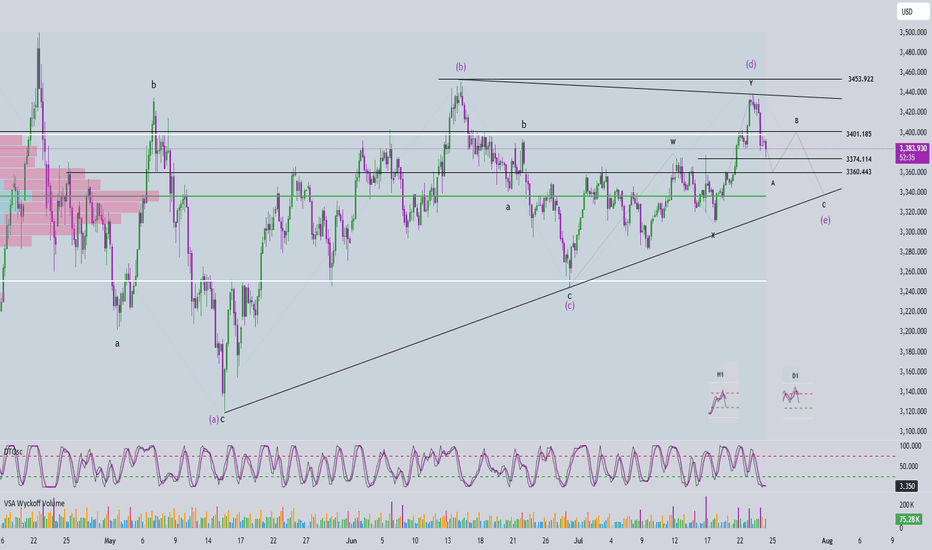
🔍 Momentum Overview • D1 timeframe: Momentum has entered the overbought zone, signaling a potential reversal within the next 1–2 sessions. That said, the current bullish leg may still extend — it’s important to wait for tomorrow’s D1 candle close for confirmation. Entering overbought territory is a warning that upside momentum is weakening. • H4 timeframe:...
🔍 Momentum Analysis D1 timeframe: Momentum is still trending downward, but we’re starting to see signs of convergence between the indicator lines. Normally, we would expect another two daily candles to reach the oversold zone and trigger a potential reversal. However, with the current narrowing pattern, we cannot rule out the possibility of an earlier reversal....
🔍 Momentum Analysis - D1 Timeframe: Momentum is currently rising → the dominant trend over the next 3 days is likely to remain bullish. - H4 Timeframe: Momentum is approaching the oversold area → just one more bearish H4 candle could complete the entry into oversold territory. - H1 Timeframe: Momentum is about to reverse downward → suggesting a short-term...
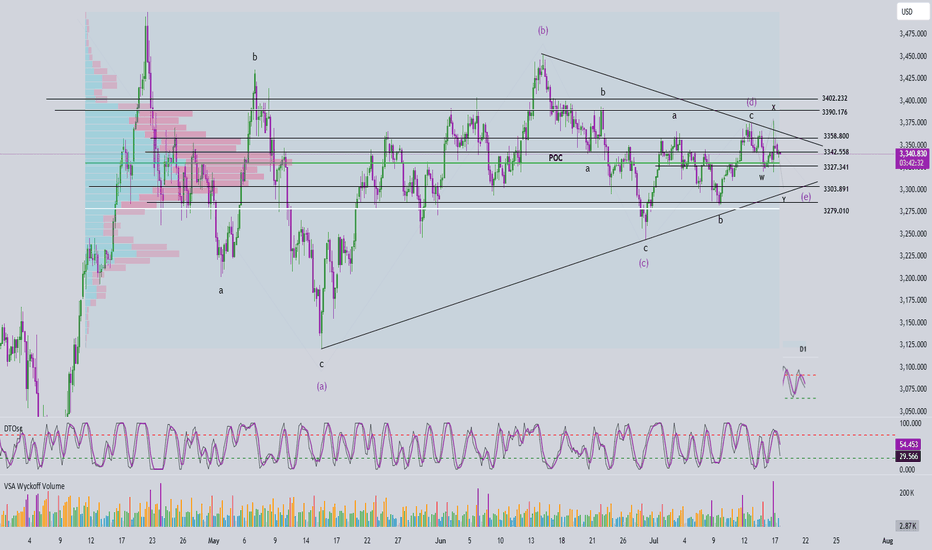
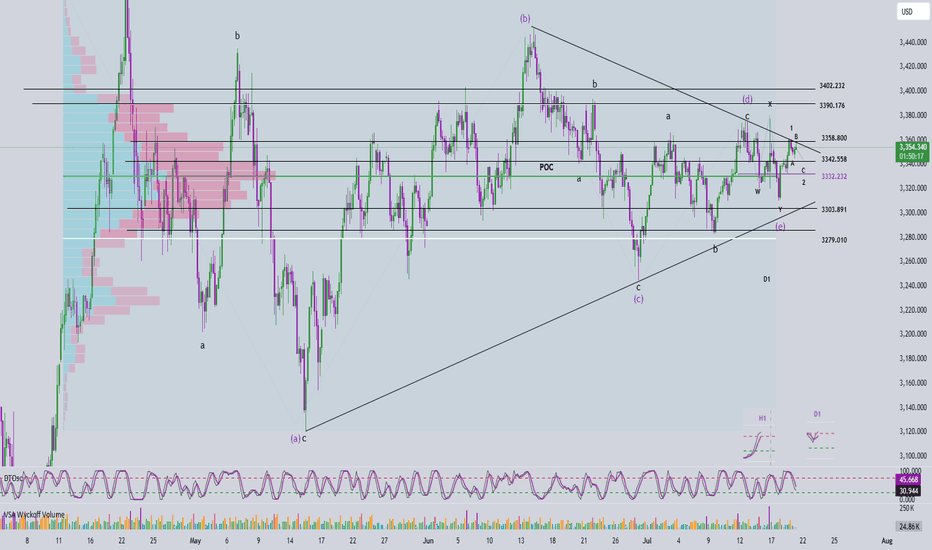
📈 Elliott Wave Analysis – XAUUSD July 18, 2025 🔍 Momentum Analysis D1 Timeframe: Momentum is showing signs of a bullish reversal. While we need to wait for today's D1 candle to close for confirmation, it's likely that yesterday’s upward move marks Wave 1, signaling the beginning of a new bullish trend. H4 Timeframe: Momentum is preparing for a bearish reversal →...
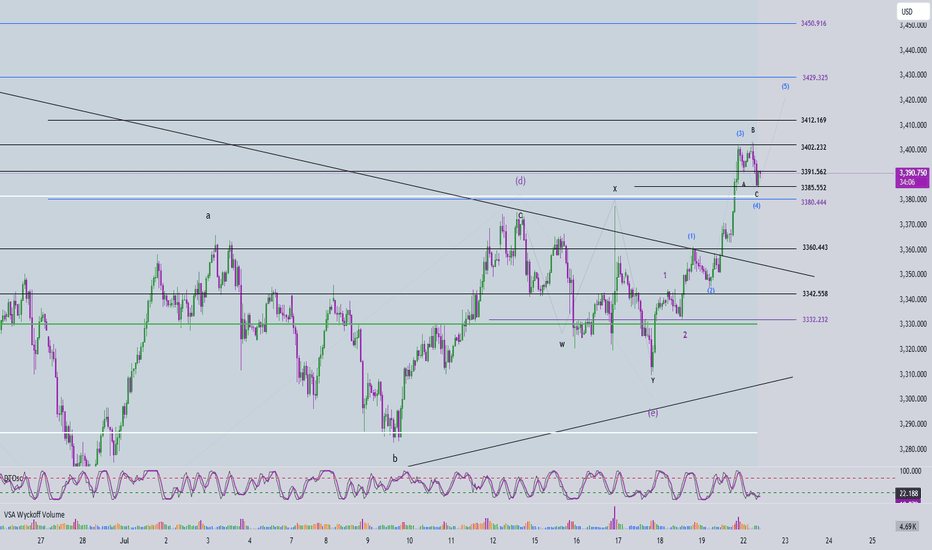
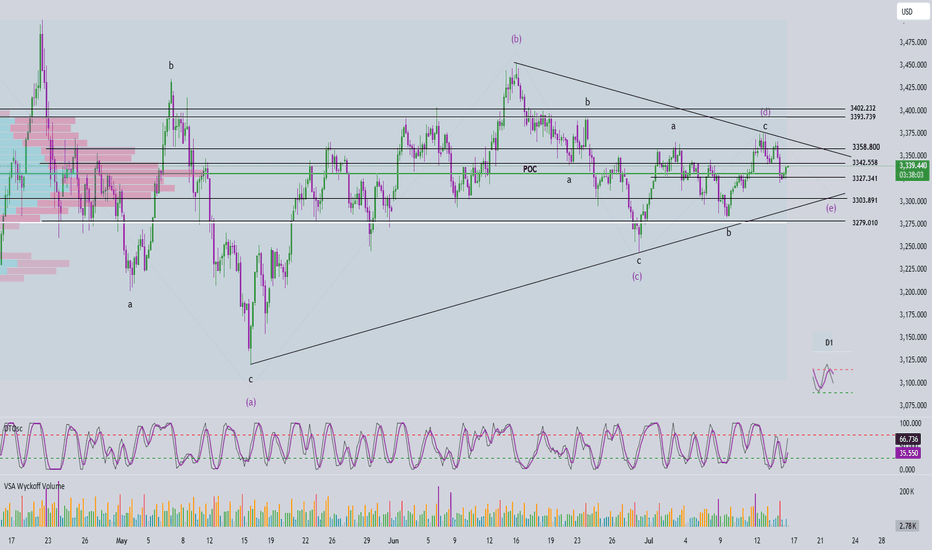
🔄 Momentum Analysis D1 timeframe: Momentum is currently reversing to the downside, suggesting that the price may continue to decline or move sideways in the short term. H4 timeframe: Momentum is rising, indicating that the current recovery may continue. The next resistance zones to watch are 3342 and 3358. 🌀 Elliott Wave Structure At present, price action is...
🔍 Momentum Analysis D1 Timeframe: Momentum is currently reversing to the upside, indicating that the bullish trend may continue into early next week (Monday). H4 Timeframe: Momentum has entered the overbought zone, suggesting that a short-term correction is likely to bring momentum back down into oversold territory. 🌀 Elliott Wave Structure On the H4 chart, we...


