The bowl is completed at the 6128.16 level, we can see this level as a sales opportunity and make some profit. When we sell, our take profit point is 10 exponentials.
The bowl is completed at the 22.133 level, we can see this level as a sales opportunity and make some profit. When we sell, our take profit point is 10 exponentials.
Let's look for closings above the Kaufman indicator in the daily time frame. Our take profit point is the wedge indicator in the weekly time frame. Take loss is the closings that may be below the wedge in the daily time frame.
Prices are above the Kaufman indicator after a long time. Our take profit point is the wedge indicator on the weekly time frame. Take loss is the closings that may be below the wedge on the daily time frame.
0.878 is our strong support point. Cutting losses in possible closings below 0.878 will be the right decision. According to your risk understanding, our first take profit and 8 exponential average. second profit point is the Kaufman indicator.
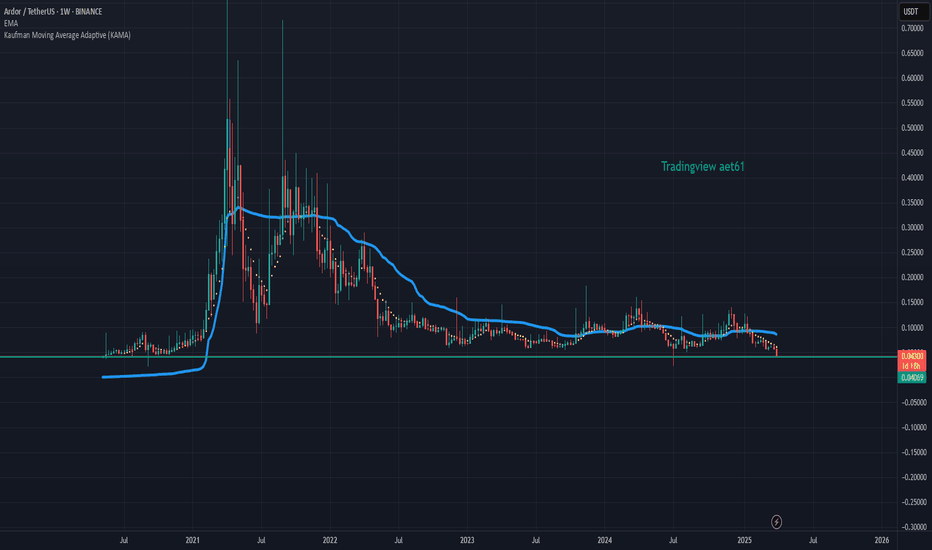
According to your risk perception, our first target point is 8 exponential moving average. Our second target point is Kaufman indicator. Stop loss would be the right decision in closings below 0.04301 level.
Although there is a cup-handle formation on the chart, the targets are drawn according to Fibonacci. Let's look for closings above the blue line.


