📊Analysis by AhmadArz: #BTCUSD By calculating the price growth in the 4-year halving time frame, we came to the conclusion that with the growth of the Bitcoin market cap, its growth will be halved and we can expect $120,000 from Bitcoin, and it is expected to grow up to 270,000 dollars in halvings. 🔗"Uncover new opportunities in the world of cryptocurrencies...
🚀 Uptrend Breakout Zone The chart shows a strong bullish breakout above the resistance level of $0.20812 and a retest of the support trendline. The upward move reached $0.38664, forming a new high. 📈 🔻 Correction Phase A sharp drop from the $0.38664 level indicates profit-taking or potential bearish divergence. The price is approaching the highlighted $0.20357...
📉 Price Trend: The price is currently trending downwards, as shown by the lower highs and the recent dip. 📊 Resistance Levels: 🔴 Strong resistance at 0.47 - 0.59. 🟪 Medium resistance near 0.39 - 0.43. 📈 Key Levels to Watch: 🟩 Current price is 0.33, hovering near a critical level of support. 🟢 Potential supports at 0.2673 and 0.2091. 🚨 Break below 0.2091 could...
📈 Overall Trend: The chart indicates significant fluctuations in the price of Diaocesan against the US Dollar. The price started at around 5400 units and has gradually decreased over time. 🛡️ Support and Resistance Levels: Support Level: The price has reached around 2140 units at several points, which can be considered a support level. Resistance Level: The...
From the data provided, CAKE's price has shown significant volatility. Starting around 2.027 in January, it surged to 3, indicating a strong bullish trend 🚀. However, it later corrected to around 2.110, suggesting a potential support level 📉. The signals in the chart hint at a possible buying opportunity at support levels, especially if the price holds above...
AAVE/USDT Chart Analysis 📊📈 Current Price Action: The current price of AAVE/USDT is around $349.58. The price has been moving inside a symmetrical triangle pattern, indicating a potential breakout soon. 📉📈 Key Support Levels: $293.23: Strong support zone that has held previously. 🛡️ Ascending Trendline: Price is respecting the upward trendline, suggesting...
❇️♨️ READY FOR A NEW ATH AND CYCLE COMPLETION? ♨️❇️ 📊 Latest #Bitcoin Analysis by #Bersipa 📊 🔥 After months of detailed trend analysis, today—December 23, 2024—we bring you the latest update. The analysis suggests Bitcoin is heading toward a new All-Time High and the final cycle peak in the next year! 🔰 Suggested Plan: ✅ Buy Zone: Accumulate in the FWB:83K –...
Share You said: give me analysis and descript signal use emoji content for caption use 200 word in content ChatGPT said: ChatGPT Caption 🚀 Ethereum (ETH) Price Prediction Alert 📊 | Key Levels & Scenarios for 2025! 🌐 Analysis & Signal The ETH/USD chart shows critical levels of interest as Ethereum gears up for potential moves: 1️⃣ Current Resistance: 🔺 At...
📈 Trend: The chart shows an upward trend within a channel. 🛑 Resistance: Key levels appear around $200 (🔍 "Wait for break $200"), $251.69, and $360.28. 🟢 Support: The highlighted level at $175.55 acts as a significant support zone. ⚠️ Breakout Watch: A breakout above $200 could signal further upward momentum. 🔺 Targets: Next potential resistance levels after $200...
📉💤 Current Price Dip: APE is trending near the lower support zone. 💎🛒 Buy Zone: Strong accumulation area highlighted for potential entries. 🚀💵 Profit Target: High breakout potential towards 1100% gain! ⚠️📊 Risk Alert: Monitor for volatility near support levels. Buy Zone (🛒): Highlight the area near 1.15 to 1.35 as the "Buy Zone" with a green rectangle or...
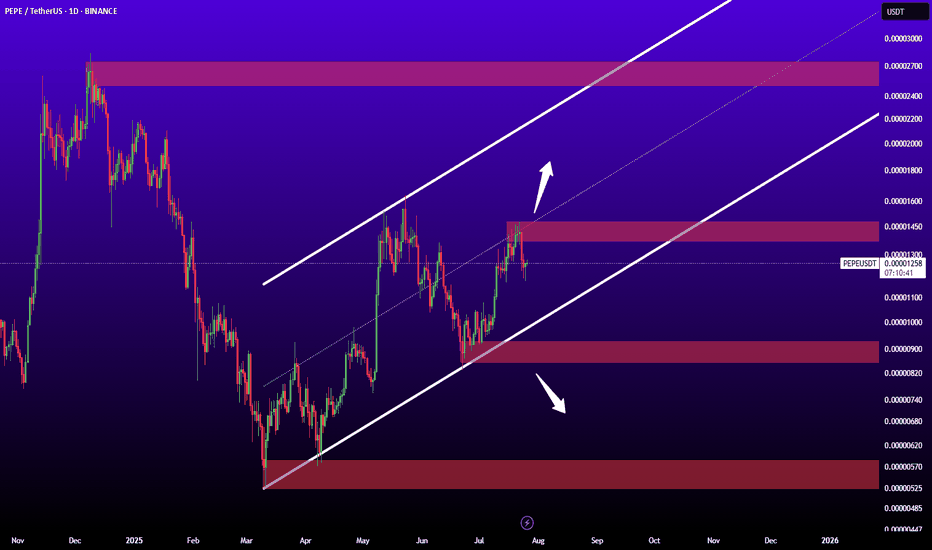
📊 PEPE/USDT Analysis 💹 🔎 After a long period of consolidation 🤝, PEPE broke out of a major resistance 💥, showing strong bullish momentum 🚀. 🎯 Current target: 120% Profit 💰 📈 Key Levels: 🟢 Support Zone: $0.00001756 – $0.00001900 🔴 Resistance Zone: $0.00002776 – $0.00003400 ⚠️ If momentum continues, we could see new highs soon 🌟. 💡 PEPE holders, are you ready for...
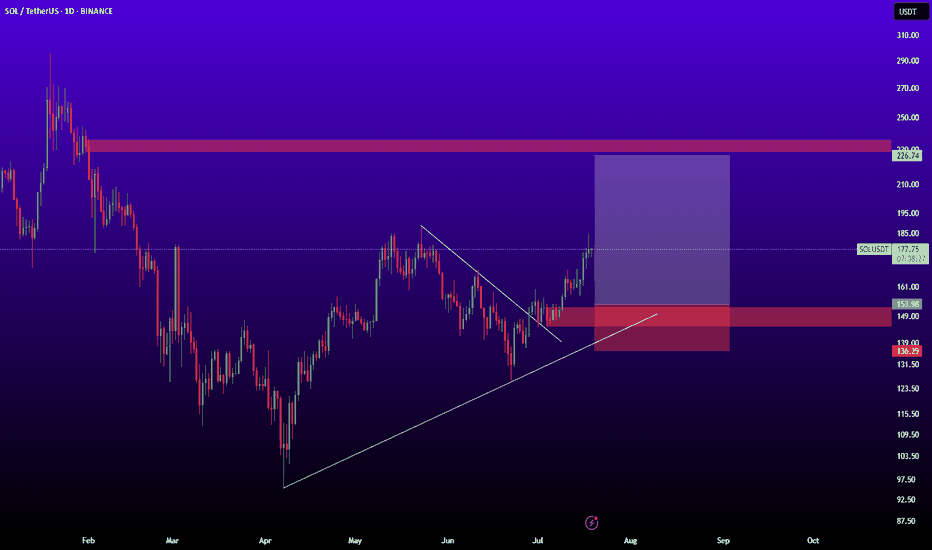
🔼 Climb to $204.46: This level acts as a key resistance. A breakout above this confirms a bullish continuation. 🎯 Next Target at $364.43: After surpassing $204.46, the next profit target offers a 160% potential gain at $364.43. 🔴 Support Zone at $190: This level is currently holding as a strong support to prevent further downside. ⚠️ Downside Risk: Breaking below...


