aman2201
PlusLast seen
Followers
1Following
1Ideas
2Scripts
0Joined May 14, 2019
chartpattern
trendanalysis
Less Tags
Show All Tags
All Types
Type
All Types
Indicators
Strategies
Libraries
All Accesses
Script access
All Accesses
Open
Protected
Invite-only
Public & Private
Privacy
Public & Private
Public
Private
TCS is trading in a channel and is near its short term support. The targets and sl will be: T1: 2120 T2: 2150 T3: 2200+ T4: 2300+ Sl: 2040 Time frame for the 1st two targets are short whereas last 2 targets can take 1-2 months to reach. Long term chart movement shows that TCS is a BUY call
1
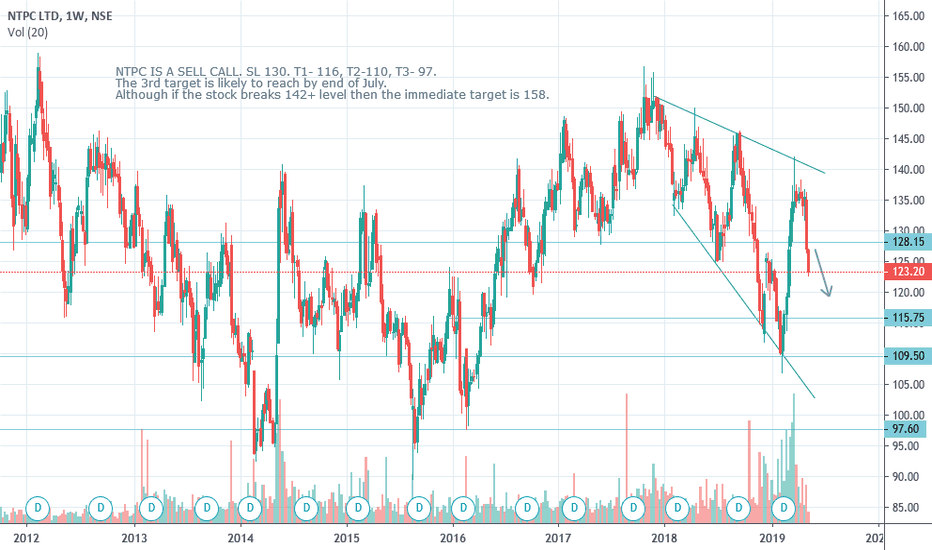
The formation of NTPC chart suggests that the stock is going to move downwards in a short term basis. We could see the following targets as suggested in the stock in 1-4 months. The third target of rupees 97 will be achieved by the end of July or August.
0
Type
Script access
Privacy


