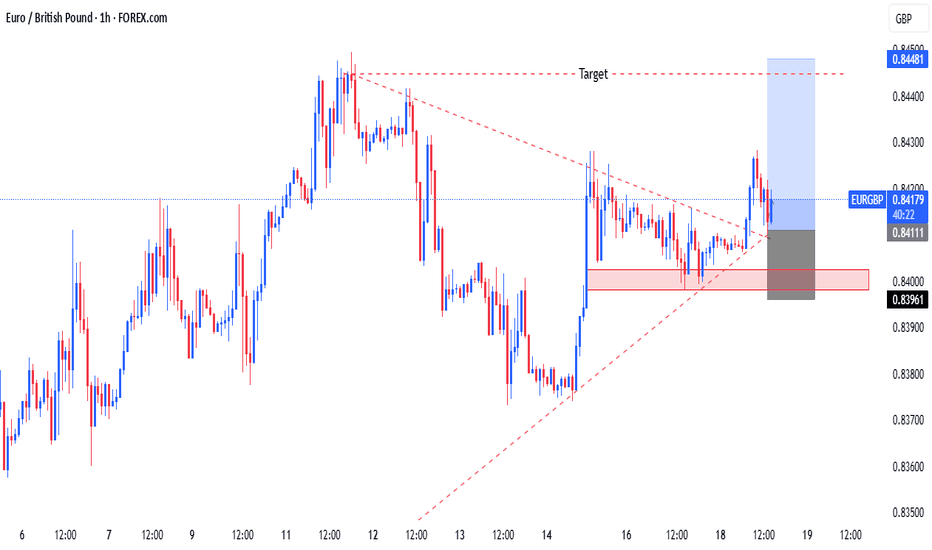
1. Market Structure The chart shows a breakout from a symmetrical triangle pattern, which signals potential bullish continuation. Price was previously consolidating inside the triangle, and now it has broken above the resistance trendline. The breakout suggests a bullish move towards the next resistance level. 2. Key Levels Support Zone (~0.8396 - 0.8411): Marked...
1. Market Structure The chart shows a bearish market structure, where price has broken a key trendline support. The price previously made higher highs and higher lows, but recently failed to continue upward and broke below the ascending trendline. This confirms a potential trend reversal to the downside. 2. Key Levels Broken Support Zone (~1.4350 - 1.4400): This...
1. Market Structure The market was previously in a downtrend but experienced a strong bullish breakout around early March. Price surged upwards, breaking a key resistance zone (now acting as support). The current price action appears to be forming a rising wedge, a potential reversal pattern. 2. Key Levels Support Zone: Around 0.9500, which was previously...
GBP/JPY 2-Hour Analysis & Possible Scenarios Current Market Structure The pair is in an uptrend, as seen from the ascending trendline. Price has reached a resistance zone around 194.5 - 195.0, where it is showing signs of rejection. The market is trading above the 50 EMA, indicating that the overall momentum is still bullish. Possible Scenarios Bullish...


