b6d1016fdeb149be865b678a8ac935
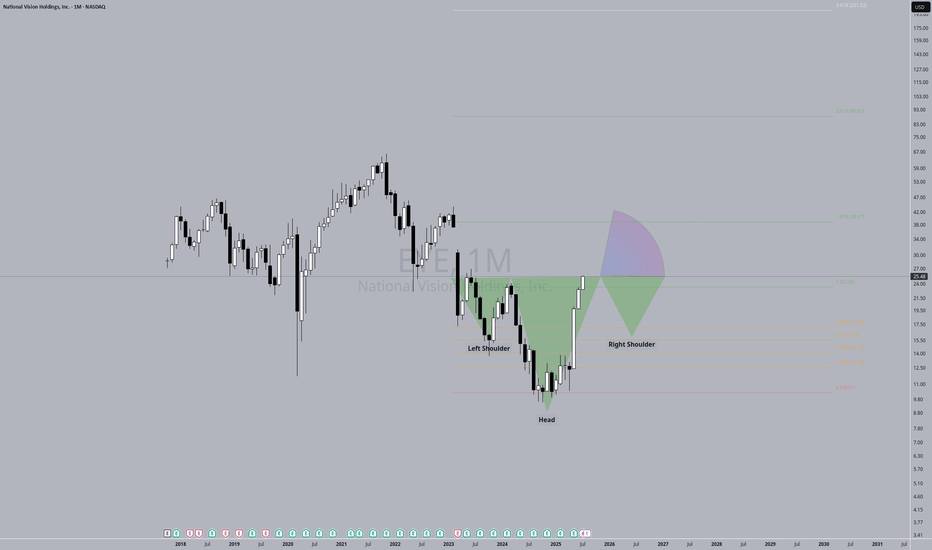
EssentialTA: I could see a pull back around to around the $17 level. Ultimately I see this going as high as $38. F: Our eyes are just getting worse, we will only be sitting in front of more screens, and taking more harmful medicines that could damage eyes. I'm long eye care.
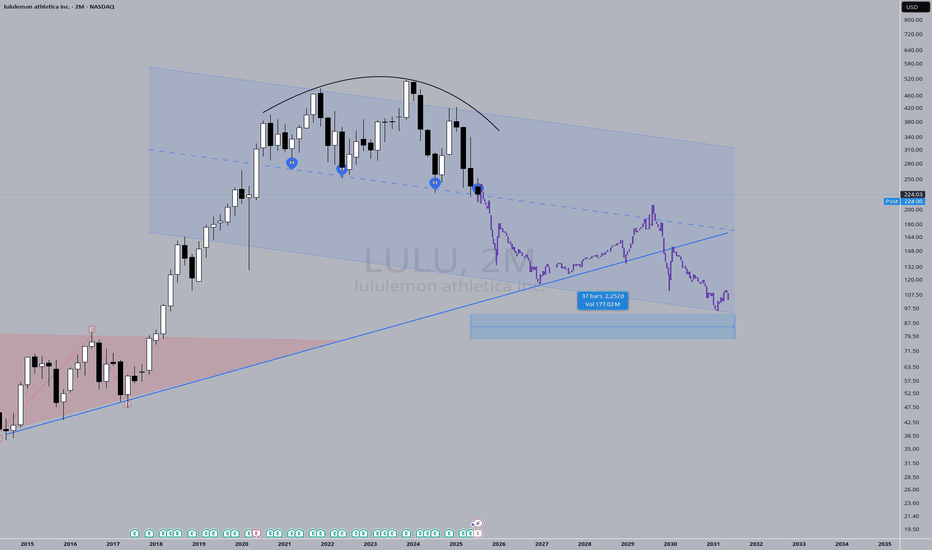
Price action has "knocked" on the support door FOUR times. It's got to give sometime soon. Fashion brands come and go, I think LULU has had it's time to shine, now it's time for another brand to emerge and take its place. I say "Mega-ultra macro" to recognize the absurdity of a 6-year guess. The probability of accurately predicting price action for a 6-year...
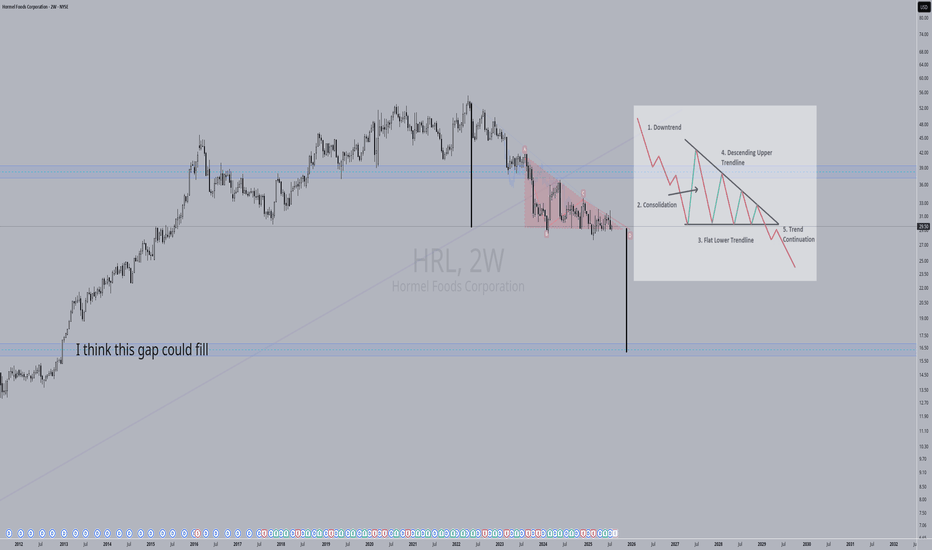
Observing price action, it appears we might be forming a descending triangle here. If this pattern confirms, I'm looking at a strong likelihood of a move down to fill the gap below current price levels. Keep an eye on support for a potential breakdown!
This pattern in stock trading is called a bear flag, right? Here's why: Prior Downtrend (Flagpole): You can see a significant downward move leading into the pattern, which forms the "flagpole." Consolidation/Correction (Flag): After the sharp drop, the price enters a period of consolidation within a defined, upward-sloping channel (or sometimes a...
This looks like an inverted Head and Shoulders doesn't it? I wouldn't be surprised if this right shoulder had a double-bottom.
I can count a 5 wave impulse (subjective) and could see a potential ABC correction down to the $16 - $23 level. As someone who makes plenty of purchases from small retailers on the SHOP infrastructure, I'm ultimately long on this stock. I hope this stock doesn't see a year or more of sliding price action. That level could easily be hit, then recover much sooner...
Price action moves violently away from 30k. I'll post more thoughts on this later. Just putting the idea out there for now.
what are the chances that price breaks out, retests resistance and goes to the moon? Small I'm guessing.
Lots of potential upside for this telco. Potentially forming a massive bull flag. Do you see a different pattern forming? I suppose this would be a buy and hold as this would take 10 years to play out. Time in the market is better than timing the market.
I believe Lumen will reclaim it's $5 price _some_ day. I don't know when, but some day. The internet could not run without Lumen and companies like them. I don't see them going anywhere. The stonk is up today on the news that James Fowler, Executive Vice President and Chief Technology Officer of Nationwide joined the board. This is a patience play, I'm long-term...
This is a Bearish perspective. Some might see a bull flag IF this price action plays out like this, however, it's possible that we could see lower lows in the form of a "Bart Simpson" pattern. Complete Speculation, but saving this idea in case the scenario plays out.
Quite the long-shot macro idea here. Looks like a H&S; is forming - if so, short from the right shoulder, DCA'ing into the position. Exit near the bottom of the triangle. After the price breaks out from the triangle, there could be fireworks to the upside, after a test and retrace. This is entertainment for me, this is not a serious post. DYOR.
This structure could be a diamond top. If it is, I could see prices falling to either of the two zones indicated in blue. Each of which happens to be previous zones of support and/or resistance.
What is a Falling Wedge ? A falling wedge is a bullish chart pattern. It typically occurs during a downtrend and is characterized by converging trendlines that slope downward. Here are the key features of a falling wedge pattern: Trendlines : A falling wedge pattern consists of two trendlines. The upper trendline connects the lower highs, sloping downward....
I've identified what I think are key support/resistance levels for Etsy. Should supports break, I've indicated where prices could go next/lower.
FTM is going parabolic. What goes up, usually comes down. Only short if you see a confluence of Bearish indicators.
A 40% drop in price seems unrealistic, however if this structure is indeed a bear flag (blue), then we could see a new low for the athletic performance apparel company headquartered in Baltimore, Maryland. That low, around the $3.40 range would form a trend line in confluence with previous lows in 2017 and 2020.
Looking back on LULU's price history, it once dropped similar to this, both price and RSI, and the dip/correction was copied using the bars pattern and applied here. The pattern fits perfectly with the blue support line. I am not long or short this security, I simply want to track my hypothesis.


