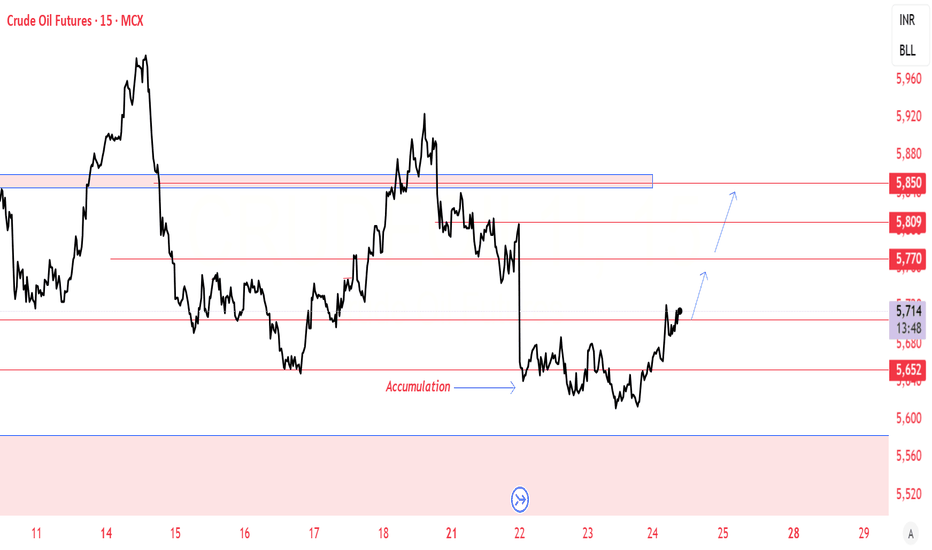
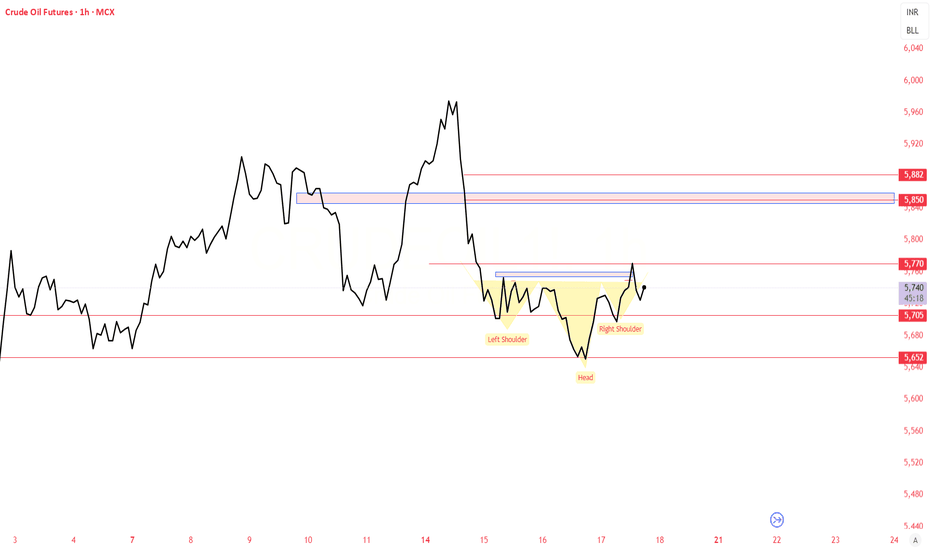
Accumulation Happened Near Support. May see 5800-5820 after drift fall. Please do your own research before taking any trading decisions
After 4 days continuous down side Some pullback relief expected till 99000. Tested trendline near support zone of 96900 and supply zone near 98200-98500-99000 Please do your own research before taking any trading decisions
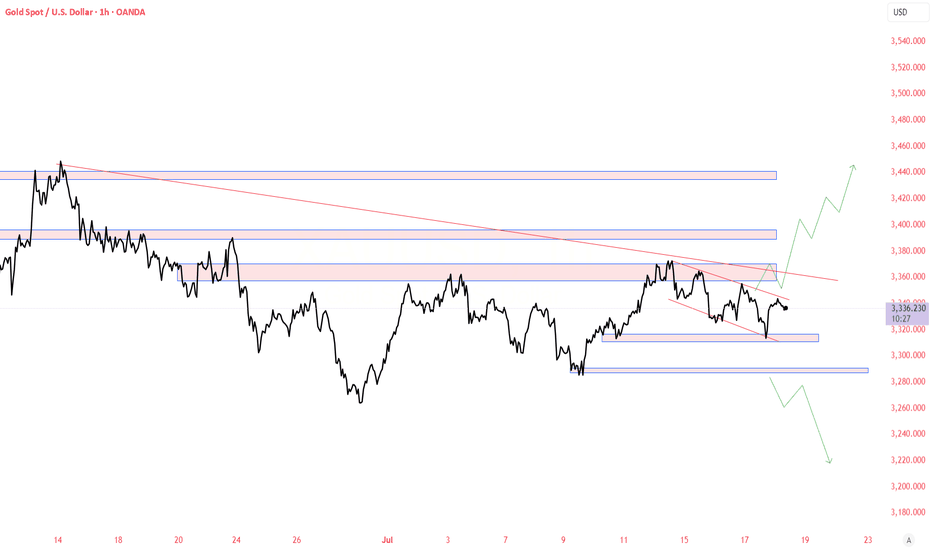
Gold Volatility being more. Banks increasing the gold inventories, may surge to new highs. Sharing Some idea it may go either way some big rally or big correction. This chart is only for educational purpose, Do your own study before taking any trades
Control Print chart seems to break the falling wedge pattern which is considered as bullish pattern. This chart is only for educational purpose and please do your own analysis before taking any trades.
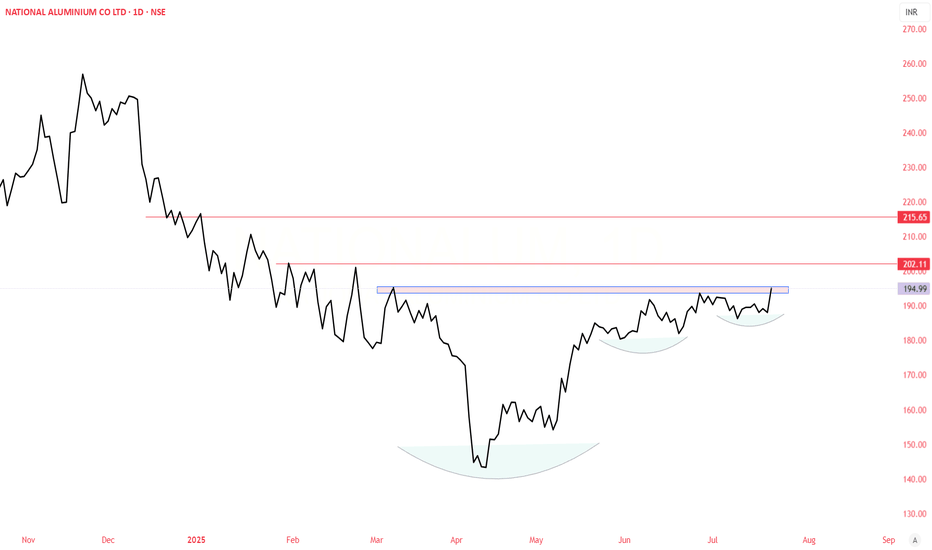
Looking at minerals demand and geopolitical tensions- National aluminum is looking bullish technically too. Making Volume Contraction Pattern, immediate resistance is 212. Please do your own research before taking any trades
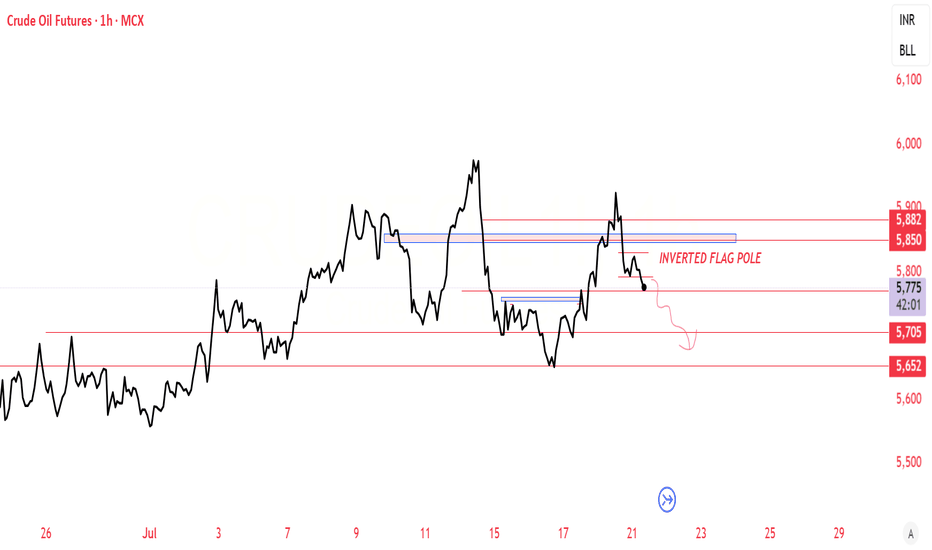
Looking at current scenario of Tarif and other major supply in crudeoil, technical also supporting the bearish view. We can see Flag Pole breakdown on 1 hr time frame. This is only for educational purpose
Crudeoil on 1 hour time frame forming Inverted head shoulder which is consider as bullish Pattern. Strong Support of 5680 , crudeoil may do 5826-5820-5850 Please do your own research before taking any trading decisions
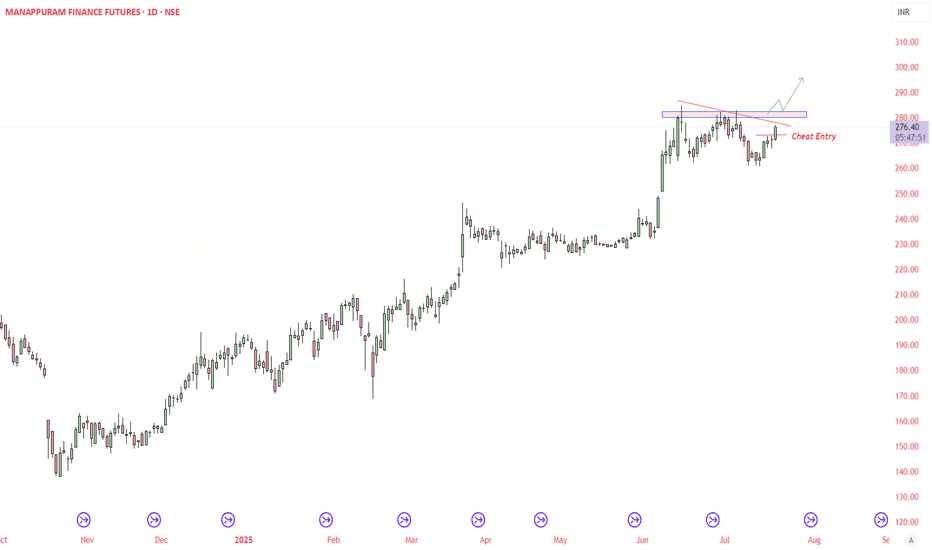
Manapuram Finance into Gold Loan business. Uptrend Chart formation with good tight structure. May do 280-282-287-290-293-296-300 upside , with 260 as strong support This chart is only for educational purpose. Please do your own research before taking any trading decisions
Crudeoil just showed a reversal from 0.618 golden fibonnaci zone. It may go till 6000-6100 levels in coming weeks with 5700 as strong support. please do your own research before taking any trades. This chart is only for educational purpose
This chart is only for educational purpose. Please do your own analysis before taking any trades.
Following are my Inputs for above chart reading - 1. MACD cross over 2. High volume Breakout of Symmetrical Triangle Pattern - Daily Time frame 3. It may go till weekly resistance line 330-340 This chart is only for educational purpose, Please contact your financial advisor for any trading or investment decisions.
All supply demand zone identified. May breach till 110000$. Please do your own research before taking any trades
Looking at copper demand in upcoming years, Bullish view are created for Hindustan copper. I have marked a wave movement that may happen during coming years. This chart is only educational purpose. Do your own study before taking any trade or financial decisions.
SAIL future getting strengthening along with metal sector in India. SAIL may surge toward 145-148 zone. This is for educational purpose only - Do your own research before taking any trades
Target of $3380 can do as per chart study. A strong Bullish candle Breakout is giving sign of momentum, Stop loss can be considered as 3361. Do your Own Research before taking any trades
Here, in chart I have tried to explain the supply zone, where we observe a volume based Breakout. above this zone there is one major zone of 332 above which we may reach the final destination of 408-410. KRBL is leading manufacturer in Basmati Rice (Famous name is India Gate Basmati Rice) after its competitor LT Foods (DAWAAT).
This chart is only for educational purpose. Do your own research before taking any trading decisions
This Chart is only for educational purpose. Do your own analysis before taking any trading decisions.
