benbllngr
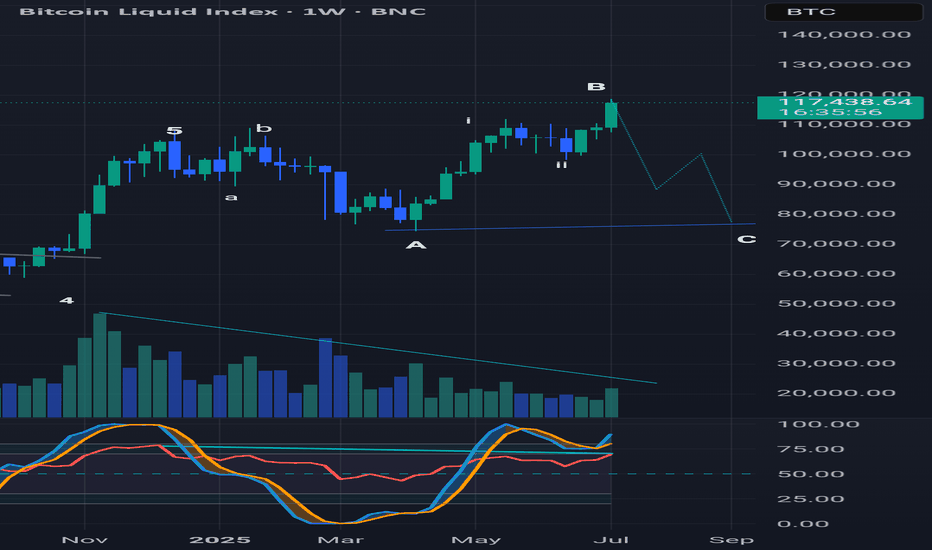
A running flat is where the B wave exceeds the starting point of wave A and the subsequent drop of wave C does not exceed the wave A low. Also note the declining volume and bearish divergence with the RSI on the weekly (and monthly) chart suggesting this move up is losing momentum.
This is a 3 wave corrective move NOT a bullish move. Looking at 111-112k then epic down side. Running flat may keep the target above 74k
ETH has formed a broadening channel pattern and may form a local bottom here, time will tell.
BTC retraced up to the 0.618 fib level in a 3 wave B. Soon it could resume the wave down to ~$100k. What do you think?
Wave 3 of 5 is coming buy area is 15400-15200. Caution buy as this is risky ⚠️ but it's always risky
Silver looking at long position - inverse head and shoulders may be forming (bullish)
Silver last Drop to $24-22 before up trend?
Silver battling at the 200dMA. Bearish divergence with the RSI. We go down for wave c of C?
Support has now turned to resistance and confirmed. Lower prices can be expected.
Rising wedge with declining volume and bearish divergence on the RSI
Also notice the bearish divergence on the RSI. This is also true for the monthly and 3 month charts from the 20k top in 2017 to the recent price action.
Breaking out of the falling wedge pattern since March 2020. Wait for confirmation (test of wedge resistance line as support)
As with Bitcoin, Ethereum is currently forming a bearish divergence on the monthly chart. This may be negated if the RSI continues higher than during the last bull market top in 2017.


