beyondthetrade
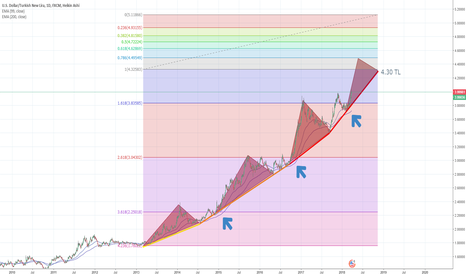
it`s a short term chart pattern about usd/try. TRY keeps continue to loose it`s value.
phase 1 Done phase 2 Done phase 3 Done phase 4 Done phase 5 on the way, we will see a similar path like before this is not a financal advise, only chart analys.
after months later we see that gold /usd reached ath and passed it 150$ more, and now its pullback time. during the 2011-2012, it tried 1575$ support level 3 times and at the 4th time it was broken, now it seems like same, it will make it a support and if it`s broken, gold will drop to 1550$ levels. this is not a financal advise, for education only.
Corona Virus changed many things, we saw things that we could never imagine just befor a few months like oil price`s lowest levels. when Corona Virus became a pandemic, people`s first reaction was selling everything to get cash and after first shock wave was passed now prices are going back to upper levels. gold is also moving to it`s ATH level but when we look...
it seems like a classic shoulder head shoulder pattern corrected by going lower RSI levels. if it always equals to lenght of distance between neckline and head as shown "h", it means price will go down $0.20
hi everyboyd, after a good pattern, XRPUSD reached to entry level and now after a few days during sideway moving, XRPUSD preparing to move higher. - Daily RSI moving up - Price goes sideway - Price dropped lowest level of last 2 years this is not an trade advice, its all about fun!
Hi friends, this chart is an idea that i guess what will happen, it doesnt supported with any thecnical analys or indicator. you know, sometimes you feel something..
A saucer, also called rounding bottom, refers to a technical charting pattern that signals a potential reversal in a security's price. It forms when that security's price has reached a low and begins trending upward
i dont care about Gold price but sometimes my friends ask me what will happen so i just wanted to look at it. this short term basic analys may help people what is going on.
stats are like mini skirts, they show many things except you really wanna see. that`s not an idea for trading, only for hobby :)
Now it`s out of control, time to visit the moon as 3rd country.. i dont want to say anything else like Ties between Turkey and America are near breaking point, economic sanctions, S-400, American embargo to Iran etc.. ,
stats are like mini skirts, they show many things except you really wanna see. that`s not an idea for trading, only for hobby :)
i just wondered bitcoin`s historical log scale data and i saw that it has 1-2-3 steps for last 2 years, now i hope it will do same thing like before :) many times many people said "bitcoin is dead" but it`s not!
Verge makes me cancer everyday... After good news like PornHub arrangement it`s still underprice, now it`s at buy zone and will rise soon. of course that chart is not a tradiging advice, a Verge holder`s hope :)
i hope it will be like that :) not for trade, just for fun! so it`s not and trade advice!


