The chart is self-explanatory. Cup and handle formation is seen on the hourly chart. Keep on Radar. Below 1100 we can see further weakness, stock can further retrace up to 1020 level. Happy Trading.
After breaking, the resistance of 3170 Asian Paints comfortably traded at 3226. The chart is self-explanatory. We can see confirmation of the trend from the following points. 1) Breakout of dynamic resistance line. 2) Fibonacci level support 3) Higher Low after consecutive Lower lows. Buying Range:3230 to 3170 Stop Loss: 3050 Expected target: 3505, 3800 to...
Very very simple logic chart is self-explanatory. Aurophama forming Cup and holder pattern at the upper edge of descending channel. If it breaks 700 level and sustains above same we can see 50 to 60 points easy run. Happy Trading...
Hello, Tradingview community. Cholafin is trading above its major resistance (Refer chart for more clarification). The chart is self-explanatory. on the hourly chart, it is clear price tested 633 level for 3 times since 19 Oct and not able to sustain above same. But 4th time it is able to break and sustain above 633 level, we can surely see some fireworks in...
Tata Motors is forming a descending triangle on a 1-hour chart. Gap to fill: There are chances to fill a gap of about 65 points that occurs on 13 Oct. Tata Motors taking support near 469 if this support breaks we can see weakness in this instrument. Happy Trading.
Very simple setup. We can see a Clear breakout above 2500, with good volume. Stock can reach up to 2800 levels in the coming several sessions. Below 2350 We can expect weakness. Happy Trading
Time frame 4 Hour Pattern: Head and shoulder. Trading near dynamic support. Sell below 1960 for the target of 150+200 points Stoploss will be @ 2021. Don't forget to like and share Happy Trading
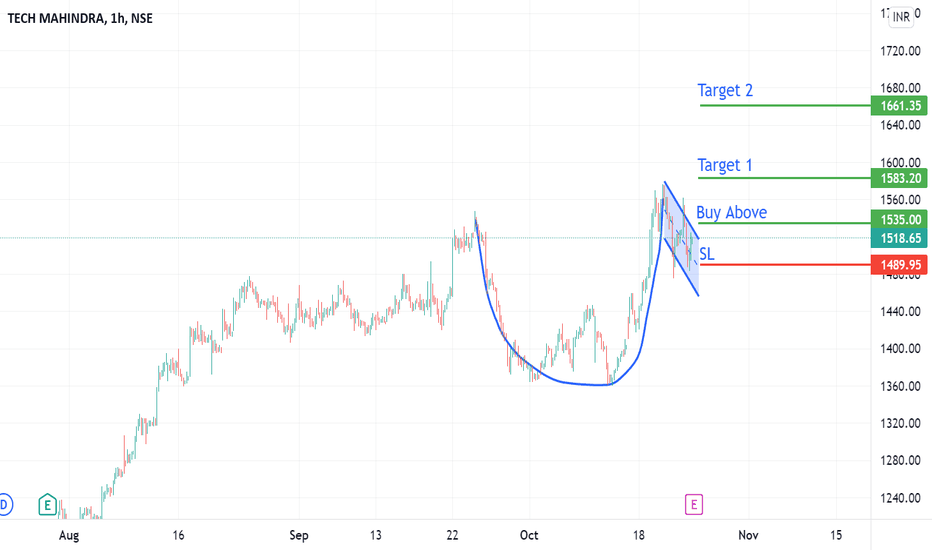
Tech Mahindra forming beautiful Cup and Handle Pattern Near Lifetime High. Keep Eye on Breakout we can expect a 150-200 points target. Hit like and share Idea Happy Trading
After Touching Low of 754 Axis Bank showed a very good recovery and Stock is trading at its resistance level. H&S patten is formed on hourly chart closing above 821 will confirm brekout and one can expect a target of 880 in coming days. Don't forget to like and share Idea. Happy Trading
cup and handle forming Cup and Handle pattern on the hourly chart. Good opportunity for Swing trade. refer chart for levels. Happy Trading. #cupandHandle #Bajajfinserv
Chat is self-explanatory. Setup is very simple only Support and trend are used. Asian Paints trading near the Support level. Asian paints is weak below 3150 can drag down 150-200 points down from level. Happy Trading.
The chart is itself explanatory. Ambuja cement testing its dynamic support as well as it is near to give head and shoulder breakout. Keep a close eye on Ambuja cement if the breakout happens and it stays below 387 then we can see more weakness. and price can drag up to 347-40 Happy Trading.


