eduardokaykedasilva
Do not consider this chart as an investment advice! . Hello guys! I'm really looking forward to XVG. In these last days I've been studying the raffia without stopping! . We are currently in a time of accumulation for VERGE! . In the past, VERGE also developed an ABCD Pattern! . I'll leave some links below. The market seems to be coming together! Leave a comment,...
. Just an upgrade from the upward triangle! . We're still inside!
Do not consider any chart as an investment advice. . More than obvious! . Just come back later to check it out! I am absolutely sure. Trust!
Do not consider this chart as an investment advice! . Just an upgrade from the upward triangle!
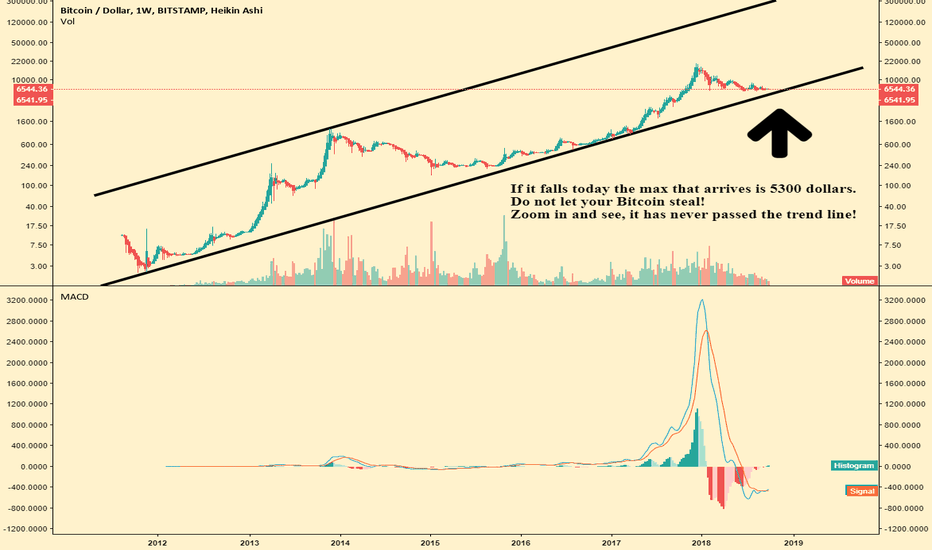
Do not consider my chart as an investment advice! Just an update from my other chart, since the BTC gave a slight exit! . Let's see if he goes back to the small upward triangle or if he's going to stick with the big one! . The white line below the triangle is a margin of error! False breaks!
Do not consider this chart as an investment advice! Hello, how are you? Well, I'm learning some ways as a means of negotiation. This idea is from a trader who ended up asking for an idea, but he did not post it in public. I do not think you want to get involved. Do not know! 1 - Well, there you are, can you see the second triangle on the right? I believe so....
Undo my graph and see all the FIB lines, is not it wonderful? Go and see, enlarge and move, you will be amazed at what you will find! See the waves. I'll leave some plausible ideas below, seeing this incredible chart. And remember, do not take my advice as a sign of investment! 1 - As you can see this chart has lines of support and resistance in addition to...
Do not use my chart as an investment advice! On this chart I'm using Elliott waves, Fibonacci, support and resistance! What do you think? It seems plausible to me! Only the future will tell us!
Do not consider the chart as investment advice!
Do not consider this as investment advice! 1 - The XVG hit 2 times in its old support of 330 satoshis. 2 - Usually currencies usually follow the BTC, see this chart, understand that we are moving up! 3 - I do not believe that the XVG drops more than 300 satoshis, I think it's very unlikely. We have a really powerful support between 300 and 325 satoshis. 4 - The...
Little correction! 1 - The DGB was very choked in this bullfight, so he decided to take a few hours off. As we can see in the daily chart it seems to me that we are still in a bullish trend! 2 - I've been studying the DGB chart for a few months now. And looking at past races we can see that there will always be grandiose corrections. And that same day she ends...
Do not consider the charts as investment advice, just use in your studies and draw your own conclusions. 1- I created this chart if we are undergoing a stronger correction where it includes the ABC. Then you have the levels to buy using the IBF. Have a good time. Well, I'll leave my other charts for you to see from another perspective.
Do not take my chart as investment advice! Leave your comment. DGB still has a lot to grow. Best currency of 2018?
Do not consider this chart as an investment advice!
Do not consider the charts as an investment advice. 1- Long lines do not show the time it took. Just my idea! It can take 3 months or less! Do not consider the charts as an investment advice.
As you are observing, our VERGE is entering a bullish trend, as is the weekly BTC chart. Just wait and see! Do not consider my charts as an investment advice.


