faisal-101
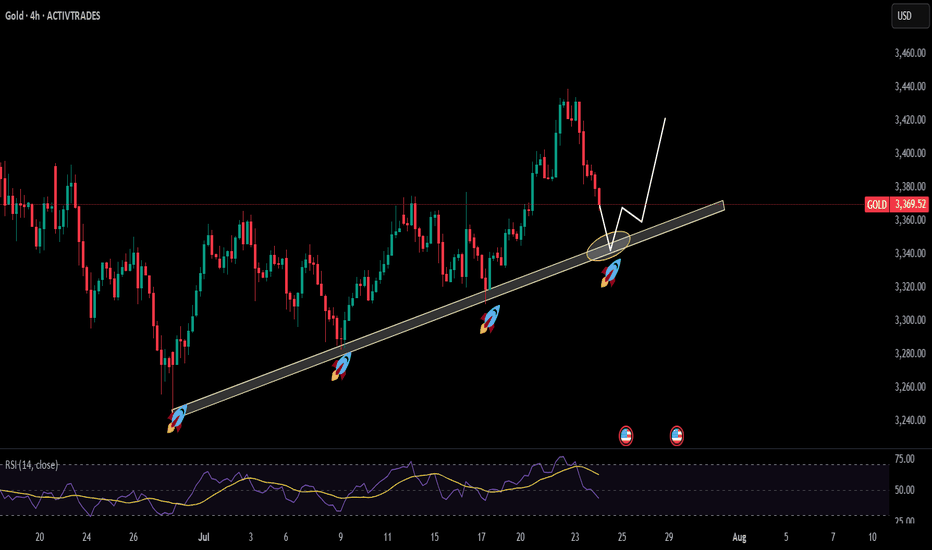
drawn trendline has been proven a major support level for gold as the price has tested it multiple times and get a decent bounce to make new highs currently price is again approaching the support level opportunity will be when price hit that level then look for buy setups on shorter tfs to get higher RR
as it can be seen that price has broken the bullish trendline with strong momentum, and along with that, it has also broken its last HL these confluences indicate a trend reversal from bullish to reversal. For more confirmation of bearish trend let the price make pullback either to make its first LH and then look for sell setups
as shown in the chart, the 4-hour tf trendline is acting as a strong support level since the price has tested it multiple times to continue the bullish trend therefore a buy trade idea has been given on the chart according to the price action
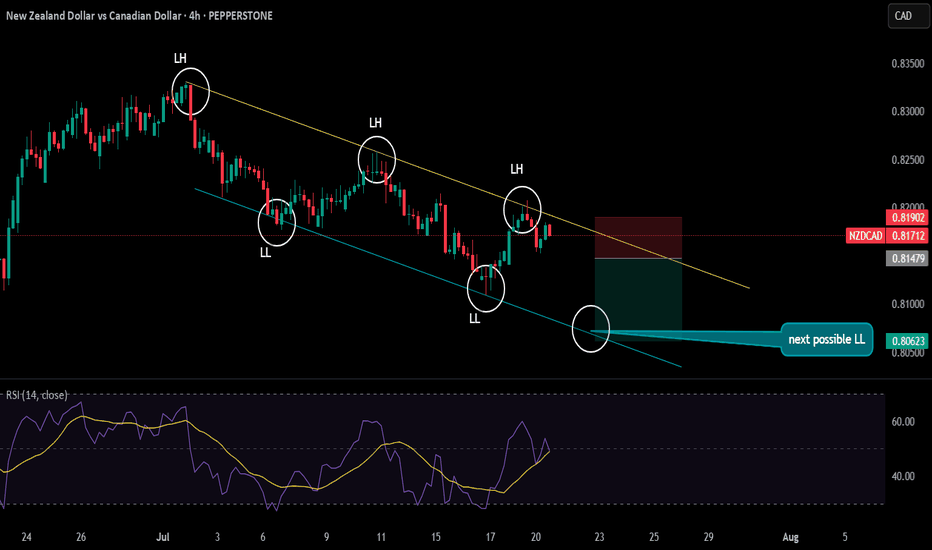
the pair is making LHs and LLs just following DOW theory right now the price has marked its LH and now it is towards marking LL and with that a simple trade idea has been shown on the chart
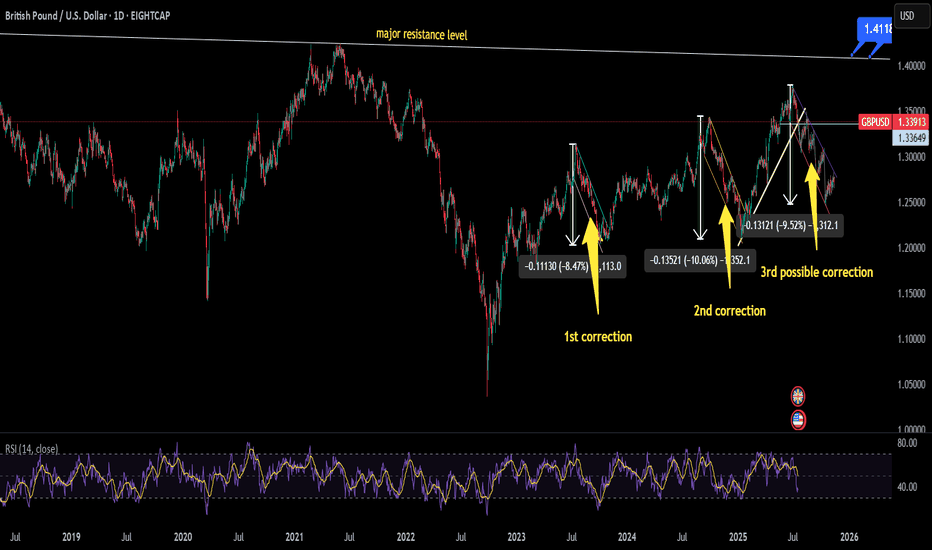
currently price is testing marked trendline which is acting as support level for a decent time if this level price will reverse its trend from here and will hit major resistance level which also has been drawn but if price action follows what it has done twice in the past then chances are that trend will enter in correction phase which is 3rd phase. In all this...
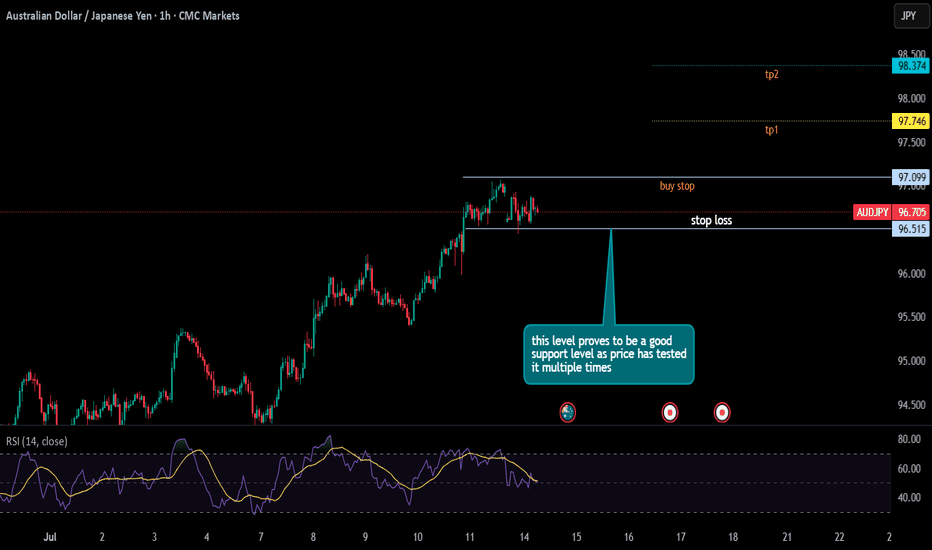
right now, the price action seems quite bullish and support level of 96.515 seems good as it has been tested multiple times if this support level remains intact then my order of buy stop looks good to go.
currently the price is breaking the trendline which was acting as strong resistance for some time. To confirm that this is reversal of trend we should and the price to retest that trendline which would be a major confluence of bullish trend
before this bullish pattern, it can be seen that price action made a channel in which it made HHs and HLs, and then a flag pattern appeared. Now, the price is breaking flag in upward direction and if this breakout is real a bullish rally can be seen
price action is making LHs & LLs and also respecting the trendline. No complications just simply following the trend
right now, the price action seems quite bullish, and RSI is just kissing "70" so there is a probability that price will make a pullback, which will be a major confluence in the continuation of the bullish trend.
as price broke the resistance (daily tf) and then made a decent pullback to retest that level and moved upwards, and now respecting the bullish trendline (4hr tf) also there is no divergence on multiple tfs with no major sign of reversal. All these confluences make this trend a bullish pair. To earn more RR 1hr or 30 min tf would be suitable, as I have also shown...
after breaking daily resistance level the price is now retesting it if you open the chart on 1Hr tf you will see that price broke that resistance level with quite strong momentum and is retracing and if it gets a bounce from this level and break the flag pattern strongly then there are high chances that price will meet the price projection of flag pattern as there...
as price has broken drawn resistance level and after that it moved upwards nicely and now the price action is making bullish flag pattern as currently there is no divergence which indicate the trend will likely continue and will hit next resistance level which is also price projection of flag pattern
price action seems quite bullish on bigger TFs which gives opportunity to earn decent RR, with latest bullish divergence it seems that trend will likely mark new HH as on 30 min TF trend is following bullish Dow theory. There can be 2 bullish setups which i have also opened on the chart. Beware of Mon gaps!!!
the coin has broken the trendline and then also retested it to confirm its bullish rally right now the price action is simply following DOW theory by making HHs & HLs. I have opened a long position on the chart with 1:2 RR.
bullish trendline seems quite intact as the price has tested multiple times, giving opportunities in long positions. Currently the price is gain going to hit that drawn support level(trendline) make sure to enter at that time. Long position has also been shown on the chart for more clarity
price action seems quite bearish when it touches the trendline it makes new LL, right now the price is in range for some time but as soon as it hit the trendline make sure to get enter in short short trade unless some major fundamental event happensshort. For more clearance i have also opened a short position on the chart with 1:3 RR
a broken trendline , after last LL price made support level and after that we can see a upward movement these confluences suggest that AUDNZD is going to start bullish rally currently the price is retracing and testing the drawn trendline. instant buy with SL just below the support zone or try to find bullish divergence on 30min or 15min tf and and then trade accordingly


