fract
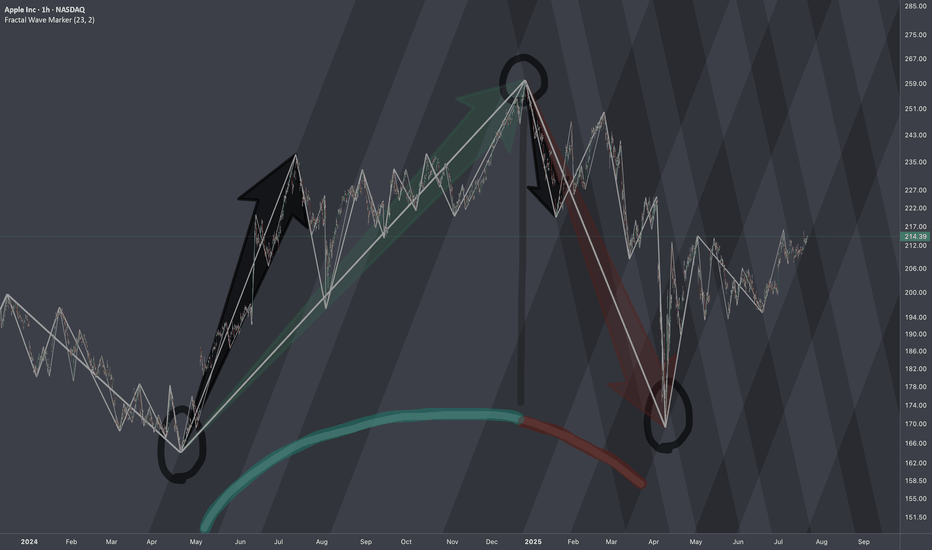
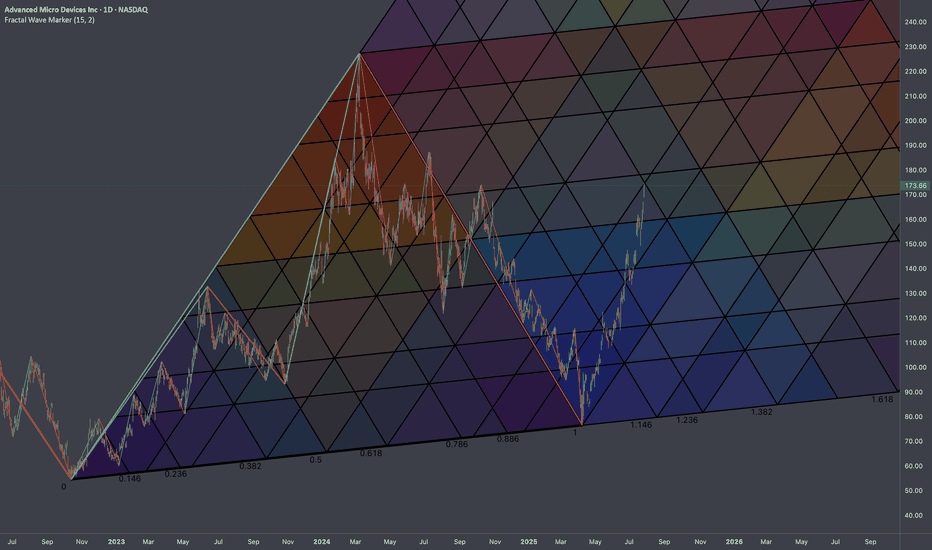
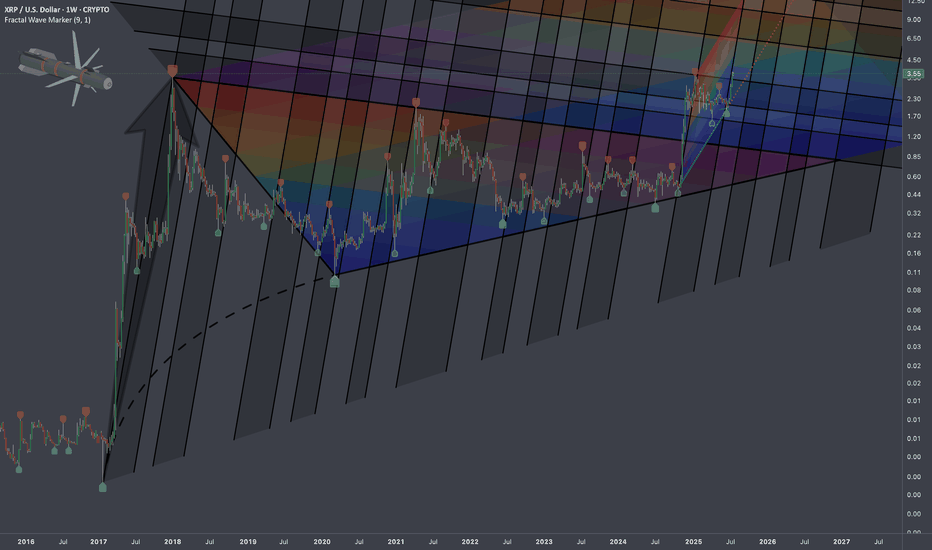
Premium🏛️ Research Notes Price is at fib boundary derived from its structure that covers growth patterns. Several attempts were taken place to push higher and ended up as lower highs. Contraction of fractal cycles and amplitude. Topologically, the compression to a point of proportional release in fibonacci proportions and scaling law 1:1 to original triangle...
🏛️ Research Notes Reaching branching effect through cross-cycle interconnection. Alongside I'll test some elements mentioned below. Local Progressions Rhyme and levels derived from apparent cycle compression. Added channels with darkening gradient that cover bullrun from mid 2019, driven by angle of tops. In the local scope, as price deepens into...
🏛️ Research Notes Original Alternative Interconnection Experimenting with cross-cycle interconnection so coordinates of the 3 point of fib channels are placed on structure's latest connecting point while abiding its original angles. When elements are extended we have a projection that looks like this: Other aspects of the shape are being tested...
Research Notes Given expression like this: Fractal Corridors can be used for horizontal perspective of the same pattern manifestation. Alternative frames of reference exposes how historic swings of various magnitude in some way wire the following price dynamics. www.tradingview.com helps to seek a matching commonality in angles of trends which gives a hint...
Research Notes Original Structure: Altering structure for experimental purposes Angle of fib channels that rises from cycle low, has been pushed into the past to the top of first major reaction. blue area resembles the change Reason The the angle of Fibonacci channels which cover the general decline (from perspective of ATH to end of cycle), are...
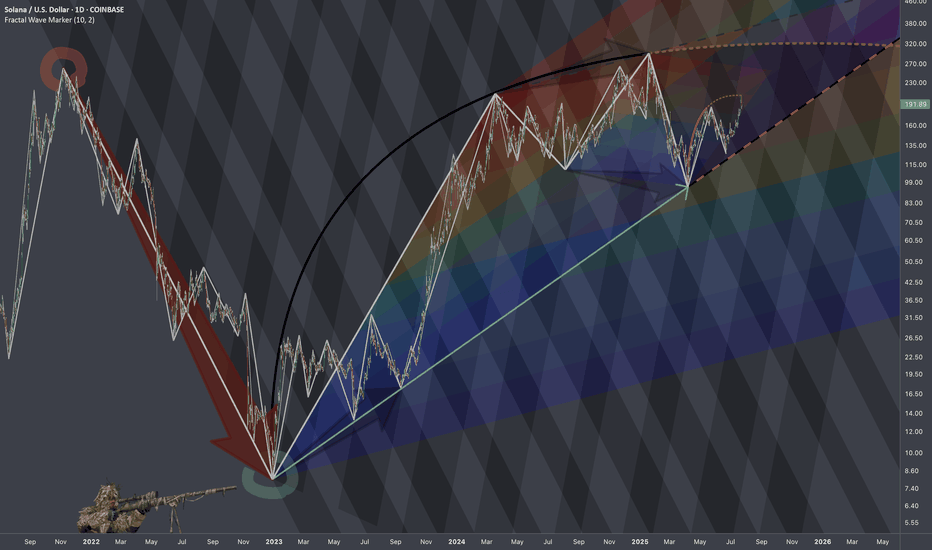
🏛️ Research Notes Keeping fib channel of the rising trend angles as they've number of times covered well that aspect of cycle texture. The other frame of reference would be with fib channel that covers drop from 2021 ATH to late 2022 bottom. Last bit would be integrating fib channel discovered while ago that connects covid & late 2022 bottoms ...
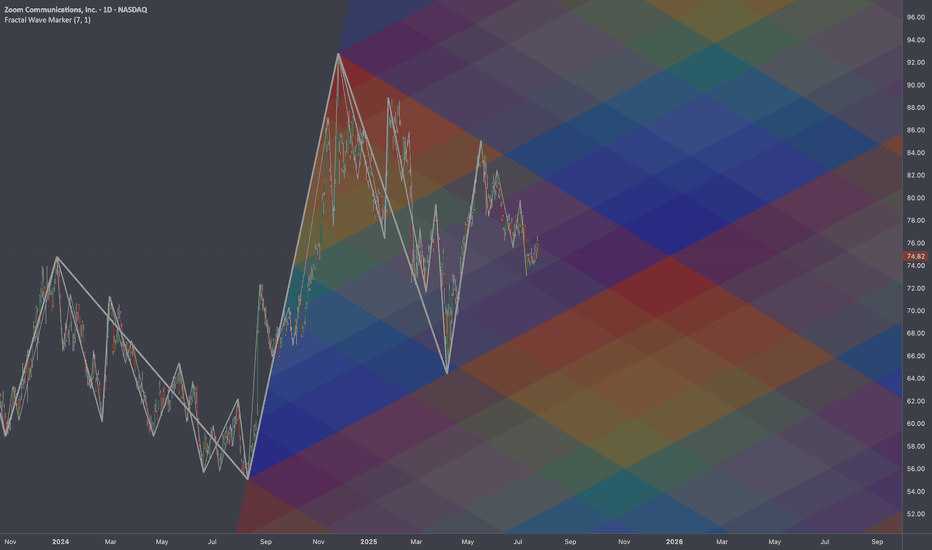
🏛️ Research Notes Fractal Corridors Shows recursive formations which indicates a full fractal cycle. The angles of decline are parallel which is important for potential buildup. To map a cycle we'd need to apply fib channel to the opposite direction In a way this should be sufficient to cover the scenarios of nearest future if we were to use bar...
🏛️ Research Notes Research on order in chaos using scaling laws and math sequences found in nature. Sierpinski triangle will be used as basic heatmap layer - orienteer for next buildups. Cross-cycle interconnection 3 cycle knot Considering the fact that structurally current price is in a new cycle, the core structure which is previous cycle can be...
🏛️ Research Notes The fact that the angle of linear connection between 3rd degree points (fractal hierarchy) acted multiple amout of times as support and eventually resistance from which tariff drop happened establishing bottom and expanding from there. That means if we were to justify the texture of ongoing wave from that bottom, we would geometrically...
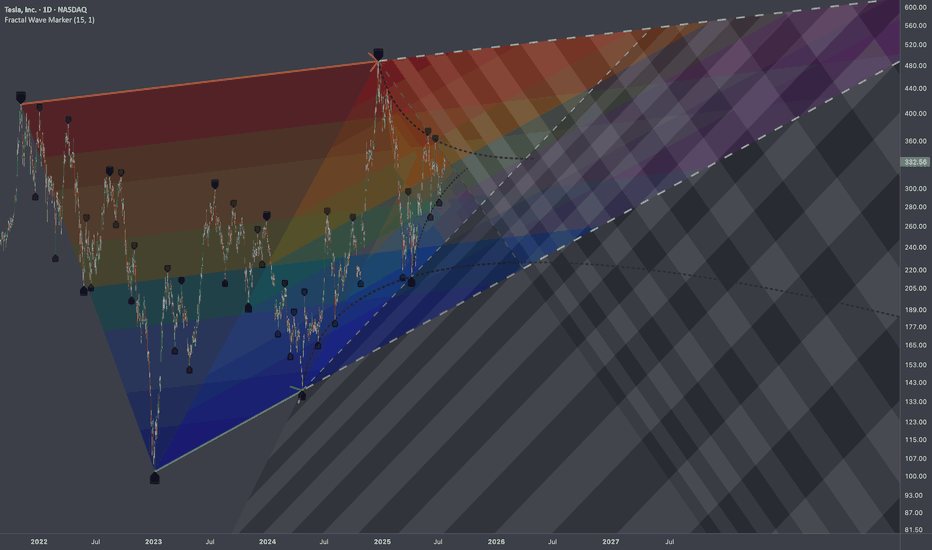
🏛️ Research Notes 3 Coordinates used for base L-H-L Fragmented with color spectrum fibs: Extending structure with same scaling laws: The chart intended to show objective structure covering unfolding progressions within cycles.
🏛️ Research Notes Apart from known compression patterns for Tesla, there is another squeeze happening on smaller scale: That area will be processed to derive the chart-based levels and see how market reacts to them. Triangle Breakout Expansion
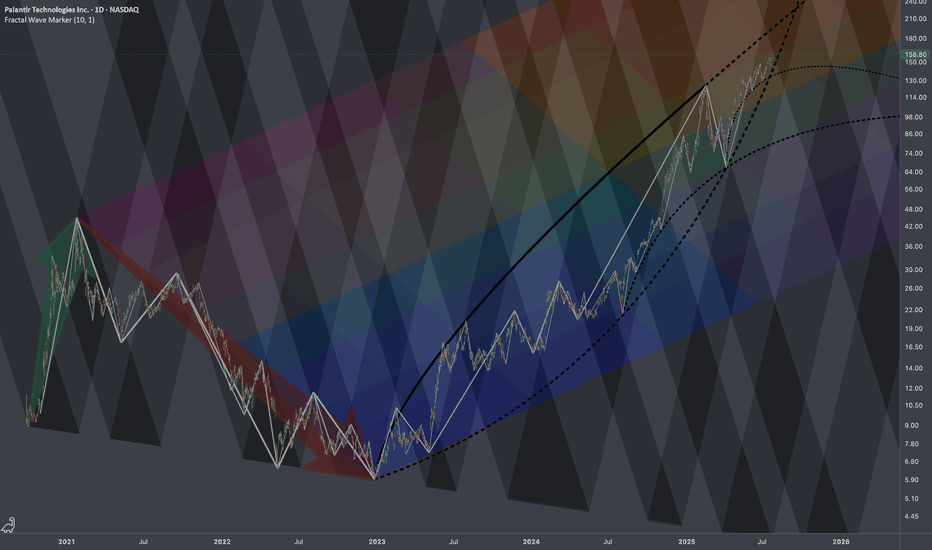
🏛️ Research Notes Technically this looks overbought, but fundamentally we know that under current administration this company is clear beneficiary (new contracts). Seems to explain why chart's dips were bought off extending bullish phases of cycle. However, there is still always a limit (as price keeps moving up, it alters the chances and magnitude of...
🏛️ Research Notes Original Structure Substitute for projection (TV's drawing tool) I was thinking if using same 3 coordinates of cycle to cover future 2-polar expansions after breakout. That's why descending fibs would start with coldest (at breakout zone it would be relevant) and vise versa. Same but with added counter-direction to produce gradient...
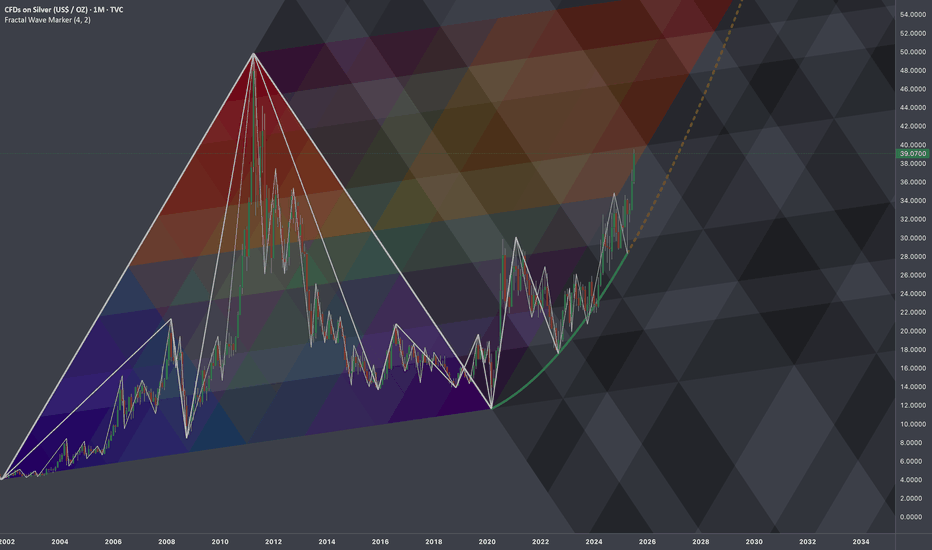
Research Notes Working out probabilistic texture using multiple fibonacci channels on just 3 coordinates of fractal cycle (late 2001 - 2020) on linear scale (on log chart it would still be relevant, so you can switch to view with right click on price scale for selection). To describe behavior of price and key levels on smaller scale starting from covid we'll...
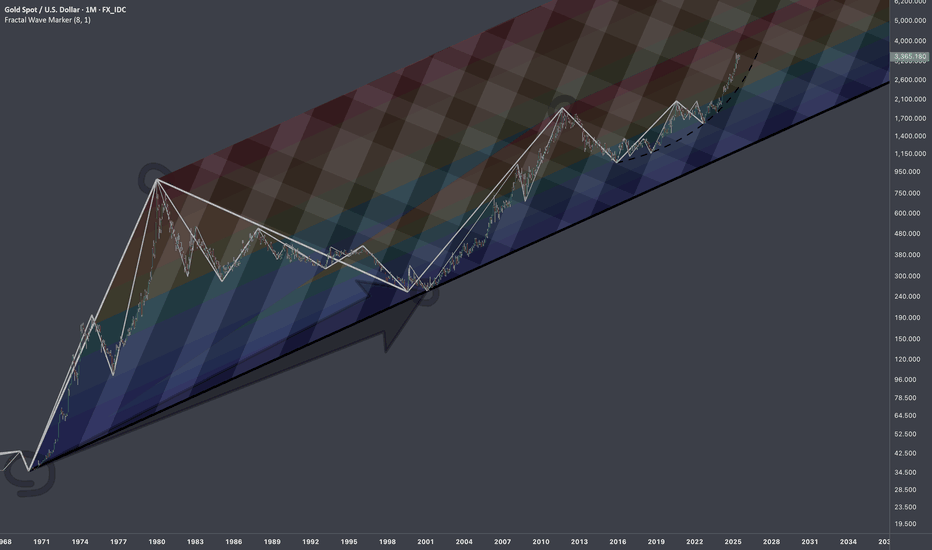
Research Notes Linking historic surface area and coordinates of consistent geometric expressions to document and learn more about the "texture" of self-organizing processes. The topology assumes that current price is a result of all history together that took to make the price end up where it is. The fastest shortcut to figure out fractal hierarchy of waves...
Research Notes Progressions here are evident so I'll use the historic bits and organize them into structure that would determine the levels inside dark highlighted zone of the local scope. If we scale back, it's hard to avoid the massive drop that structurally can serve as reference point.
Research Notes Identified structural compressions happening within two periods: This set has provided a perfect opportunity to study exponential fibs with growth rate starting from phi^1/4 applied to area of expression of squeeze. Geometrically, gives a better sense of a continuity than regular fibs.
🏛️ Research Notes Documenting interconnections where historic area and coordinates of formations are used to express geometry of ongoing cycle. If we scale out the chart back starting from roughly 2016, we can see more pretext like how the price was wired before decisive breakout from triangle. Integrating fib channel to the angle of growth phase of the...


