gordonscottcmt
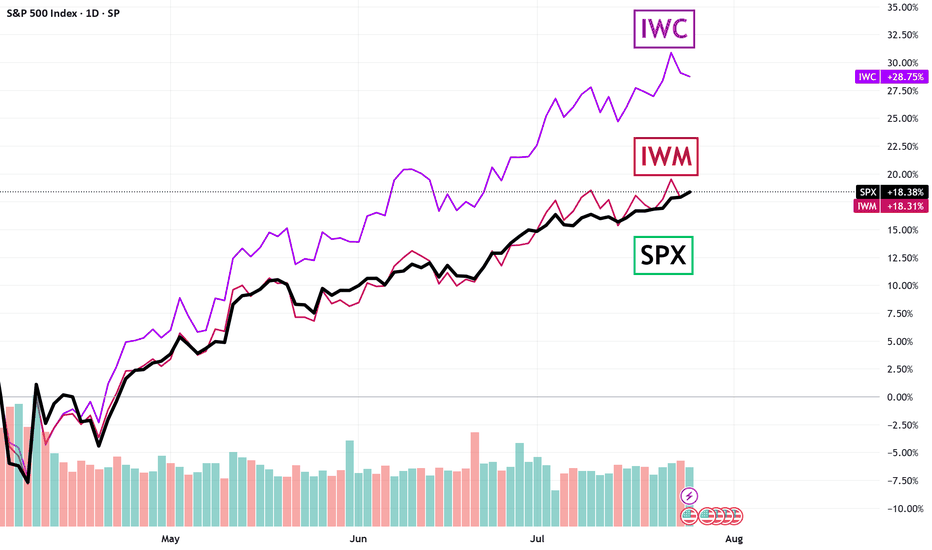
EssentialSmall and microcap stocks have that reputation for being "icky" but they are currently looking like anything but that!
The last time this happened was 1998, and stock investors loved it!
No doubt you are aware of the serious run Gold made so far in 2025, and you might also be aware that Silver is catching up fast lately. But have you thought to take a look at Gold and Silver mining stocks and the ETFs that track them? As Robin might have said (but never did), "Holy prospectors Batman, these stocks are flying higher!" It is a real question...
If you look historically at price volatility, what you see is that bear markets make big candles, while bull markets churn out a lot of small ones. Even though a rebound seems imminent, don't overlook the fact that the candles, relatively speaking, are still big.
If you create a portfolio of equal parts AAPL, MSFT and NVDA, you'd have an index that represents 25% of the numerical influence on QQQ. Those three stocks account for most of the directional move of the Nasdaq 100. They are the bullies on the block and you aren't getting around them. Where they go the index will surely follow. So far this year that portfolio is...
It seems there are a dozen technical reasons to expect a Bear Market in U.S. Stocks in 2025, but the VIX isn't one of them. At least not right now. Not sure what that is, but it may be because option prices are dropping now that the tariff scare is basically over. This chart comparing SPX with 1-VIX lays out the case.
Two up days this week on top of pricing holding support in the previous week. Sound like a good time to be a buyer? Consider this weekly chart of SPX and its trendline over the last year. When was the last time you saw price make a new high that began like this? Oh it can happen, I'm just point out that it is a low-probability bet right now. It would be far...
Usually when the VIX (candlesticks) retraces, and closes, 50% lower from a rapid swing high, it is often provides a pretty well-timed entry for a bullish trade on SPX (black line shown in chart). But this time around I'm cautious. The gradual build up and gradual decline seems to indicate something stronger is at play, something the market can't shrug off. This...
Does this gut-punch to the RE tech industry signal a looming share price drop for BLK? An index of Z+OPEN+RDFN+HOUS has had a very high positive correlation to BLK--until now when the index took a hit from the NAR settlement.
Tech stocks look poised to open lower but rise mildly. The Edge Finder software implies that this setup, which typically would have about a 70% probability of winning, historically plays out with an 80% win rate, suggesting a 10% edge in such trades.
This trade idea assumes that the unusual range move signals a higher probability of a trend continuation, even if there is a short-term reversal. The Edge Finder software suggests that a Limit order of 44.78 on FCX with a 5% stop and a 5% target, a trade which normally has a 50% probability of winning or losing, has historically won 73% of the time in an average of 10 days
For today only, until the end of the NY session, the Edge Finder suggests that a trader could enter a long trade on NZDUSD with a 100 pip stop and a 51 pip target. This implies a baseline win probability of 66%, but the Edge Finder solution historically shows an 8% edge, implying a 74% probability of winning the 51 pip as long as you enter the trade below .6100. ...
For the next 24 hours, the Edge Finder system suggests that a trader could risk 100 pips to make 10 pips entering short at any price above 1.0100. Sounds crazy but this trade has a 5% edge historically, meaning if the setup (risk 10 to make 1) gives you a 90% probability even with random price moves, this setup up, historically, has won 95% of the time. Since...
From the book "Invest to Win" here are my latest Stop and Go signals.
CDNA is three days past its large down day following a small gap. This kind of trade setup shows a positive edge if you wait for three days after the drop to execute a buy. Let's see if it works this time!
This entry qualifies both as a Crossover Gap and a KCA Surge signal. These signals appear to show a sustained an persistent edge over time so even if the next trade showing them doesn't turn profitable, statistically they are worth taking. Risk only 1% per trade and make enough of these trades and you'll see the benefit.
Just for fun, I thought I'd use the ghost feed to fill in a "maybe" scenario for 2023
Buy stop at 1.54310 Stop at 1.53110 Target at 1.54910 120 pip stop, 60 pip target, with lots of room to run beyond the target. 68% probability of success for hitting the 60 pip target. (note: image target is wrongly labeled on image, should be 1.54910)


