iFix_Trader
It seems that we have reached the top of an ascending channel, and a correction can be expected.
The price is trading within an ascending channel and currently testing support. A bullish divergence on the MACD suggests a potential upward move in the near term.
ONDO/USDT – Potential Breakout from Bullish Triangle Formation Description: ONDO is currently forming a bullish symmetrical triangle on the 4H chart, following a successful breakout from a falling wedge pattern. The price is consolidating and appears to be building momentum for a potential sharp move to the upside. A breakout above the $0.90–$0.942 resistance...
Hey guys Bitcoin has recently broken out of a long-term descending channel, which has caught the attention of many traders. Typically, once the price stabilizes outside of such a channel with confirmed candlestick closes, buyers enter the market in anticipation of a bullish move. However, it's important to be cautious. There is still a possibility that the price...
In my personal technical analysis, Bitcoin appears poised to revisit the order block zone between $73,000 and $69,000. If price reacts strongly from this area, following the blue trendlines I've drawn, it could resume its upward trajectory toward the top of the channel. This bullish momentum has the potential to play out through the end of 2025.
In my personal technical analysis, Bitcoin appears poised to revisit the order block zone between $73,000 and $69,000. If price reacts strongly from this area, following the blue trendlines I've drawn, it could resume its upward trajectory toward the top of the channel. This bullish momentum has the potential to play out through the end of 2025. Best Regards
If the downward trend continues, these two scenarios are likely. However, if the upper resistance of the channel is broken, the trend will change.
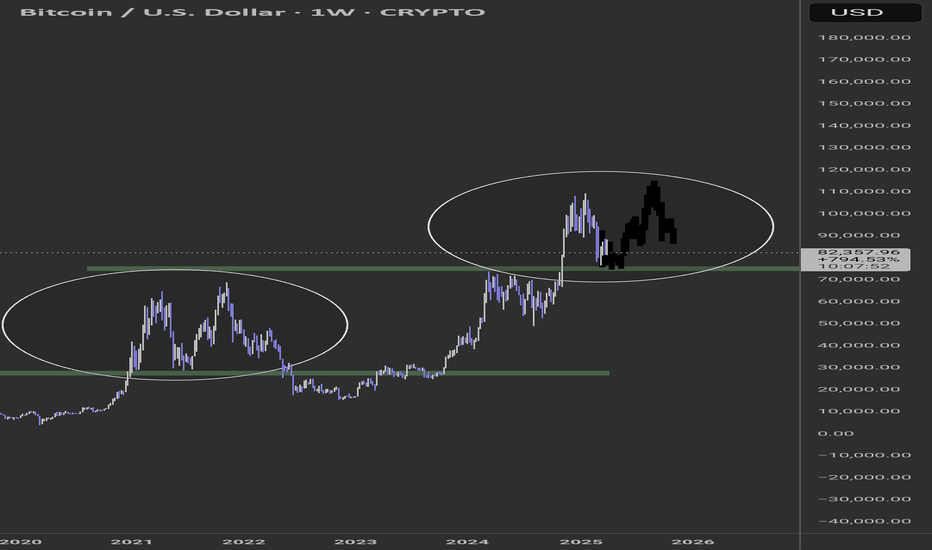
As you can see, Bitcoin is forming a repeating pattern which I’ve highlighted in the lower circle. It could form the black pattern and exactly repeat history. For now, we have to wait and see.
Hey trader's As you can see, Bitcoin is forming a repeating pattern which I’ve highlighted in the lower circle. It could form the black pattern and exactly repeat history. For now, we have to wait and see.
1. 200-Day Moving Average (Yellow Line): The current Bitcoin price is below this moving average, indicating a bearish trend or weakness in upward momentum. Typically, when the price is below the MA200, it acts as resistance, increasing the likelihood of further declines. 2. Ichimoku Indicator: The red cloud in the future suggests a bearish outlook and may act...
Given the RSI in the past and now that I have drawn a line around it, history could repeat itself and a 240% move could occur. This is not a buy or sell signal, it is purely a personal analysis.
Given the RSI in the past and now that I have drawn a line around it, history could repeat itself and a 240% move could occur. This is not a buy or sell signal, it is purely a personal analysis.


