iamtradingdon
Essential🧠 OANDA:XAUUSD Market Outlook: Gold (XAU/USD) ✅ Bullish Case (Upside Bias) • Price has reclaimed multiple Fair Value Gaps (FVGs) on the way up. • Holding above the 0.382 Fib level (3293) indicates moderate bullish momentum. • A confirmed breakout above 3301 (0.5 Fib) may open the path to key resistance levels: • 3308 (0.618 Fib) • 3314 (0.705 Fib) • 3319...
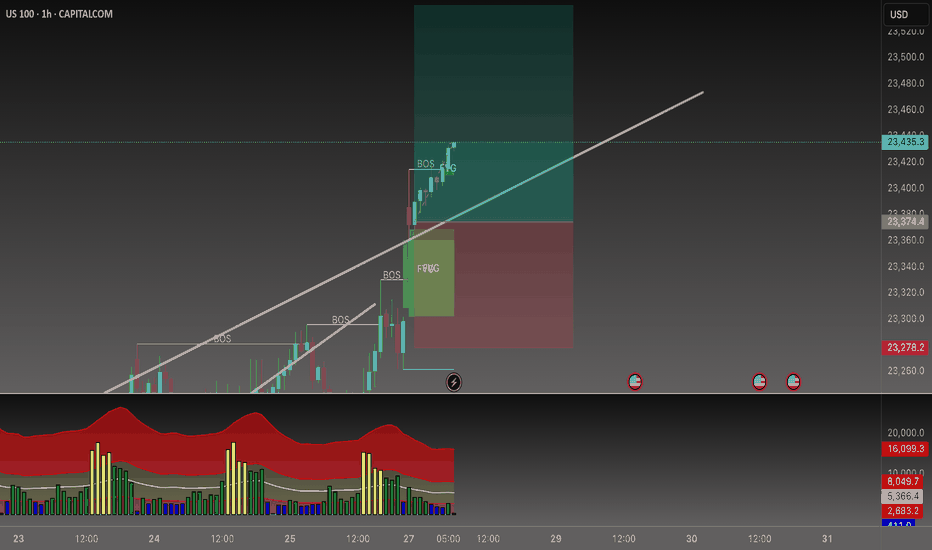
📊 CAPITALCOM:US100 Analysis Today, NAS100 opened with a huge gap up following former President Trump’s announcement that the U.S. has officially reached a trade agreement with the European Union. 🕳️ After price rejected the gap zone, and volume gets low low. I’m now looking for a potential test of the 23,540 level. 💼 With Q2 earnings season kicking off,...
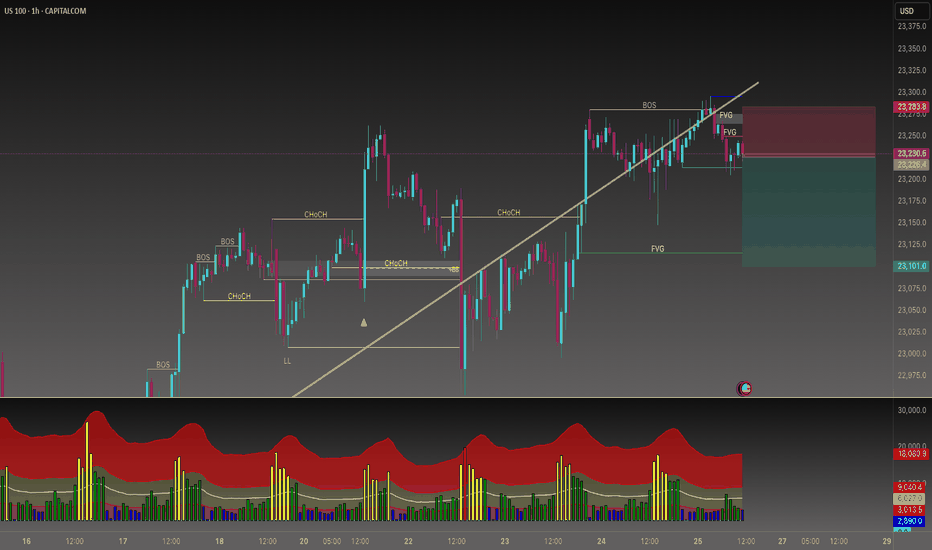
📉 Sell-Side Bias Activated After PEPPERSTONE:NAS100 confirming the trend shift with a clean Break of Structure (BOS) and a strong rejection from the FVG (Fair Value Gap) zone, price failed to hold above 23,275. This move validated the liquidity sweep and imbalance fill. Multiple FVGs stacked above suggest premium pricing and further downside potential. 🧠 I’m...
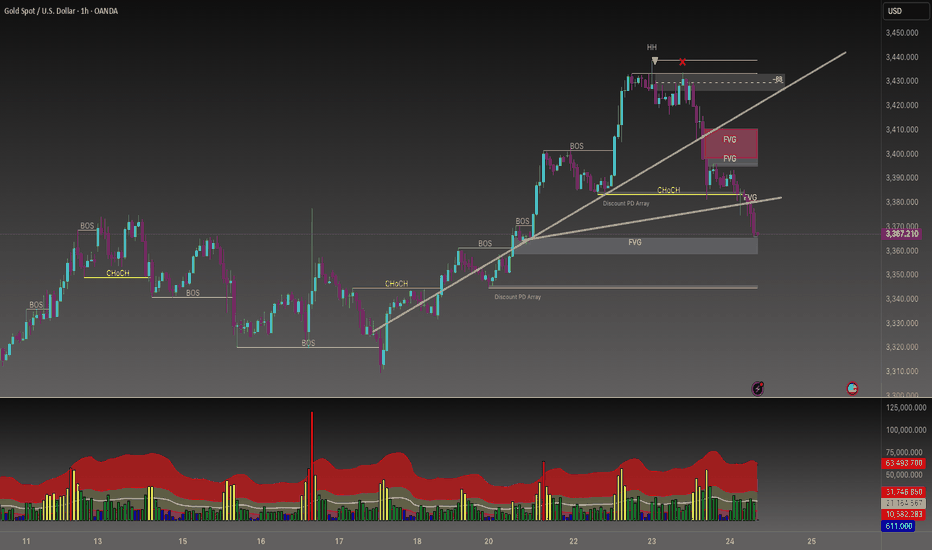
If OANDA:XAUUSD gives us a strong bearish close below 3,365, I’m expecting momentum to kick in fast. With New York opening up, a swift move to 3,345 is on the table a level we’ve already marked in the Discount PD Array. But if price holds steady around 3,365 and shows signs of rejection, I’m watching for a sharp bounce. A solid rejection with a spike could send...
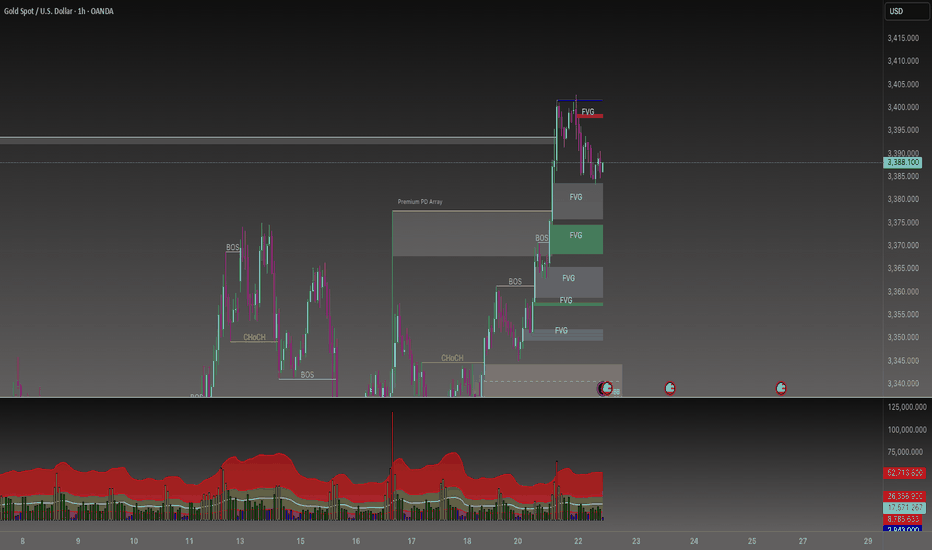
Spotted a clean FVG with sharp rejection off the zone. I’m expecting Gold to bounce up, fill the bearish FVG above, and retest 3,395.80.
🧭 CAPITALCOM:US100 Market Interpretation & Scenarios 🟢 Accumulation Zone (Demand / Buy-Side Liquidity) 21,640–21,720 region • Strong buying reaction post-CHoCH + bullish BOS. • Green FVG + “Long” entry = Smart Money likely accumulating. • Price made a new HH and is now retracing into the gray FVG & BB zone. • 🔍 If 21,800–21,775 holds, price may push...
Alright, folks: here’s my take on today’s 15‑minute CAPITALCOM:US100 action—Buckle up.📈 **When the Market Faked Us Out** I was watching price flirt with a fresh high up around 18,500–18,550, but it couldn’t stick. You know that moment: the rally teases you into thinking bulls have taken over, then promptly rolls over. I marked the false higher‑high with a tiny...
Here’s the CAPITALCOM:US100 lowdown: That “bullish reversal??” tag’s throwing up a question mark because nothing’s set in stone yet—if the market holds above the 18,400 sweep low and starts pushing past recent swing highs around 18,650–18,700, especially knocking off that short label near 18,700, it could kickstart a short-term bullish turn; but if it rallies...
The market might have finished its liquidity grab below recent lows—the so-called “sweep” near 1.2900—and could be ready to bounce back if the broader timeframe stays bullish. 1. Entry Signal: A clear 1-hour close above 1.2950–1.2960 (and perhaps a retest) would indicate that buyers are stepping back in. 2. Entry Idea: Go long if the price breaks and holds above...
If the Pound closes with a bearish candle below the Fibonacci level at 1.29456 on the hourly chart, I’m setting my target at 1.28849—that’s where you’ll see the panda.
If OANDA:GBPUSD this candle closes on the 30-minute chart with FVG confirmation and a strong bullish body, I’m setting my target at the first Fibonacci level of 1.29451. And if that level gets broken by a bullish candle, I’m aiming for the trendline crossover at 1.29800.
I’ve spotted CAPITALCOM:US100 two confirmations with NQ: first, the trend (marked in white), and second, the +AA signal. With these in place, I’m expecting bullish momentum on the NQ. The initial target is 19,730, and if we get a strong bullish close followed by some rejection, I’m looking for the price to reach 19,830.
I’ve seen the price sitting in discount territory, and the Fibonacci trend line is already broken. If GBPUSD closes a 1-hour candle below that trend line with strong bearish momentum and tears through the purple box, I’m aiming for 1.29547. On the flip side, if GBPUSD closes a 1-hour candle above the trend line with solid bullish momentum, I’m eyeing 1.30315 as resistance.
If the NQ CAPITALCOM:US100 closes a 1-hour candle below the Fibonacci trend line and shows strong bearish momentum, I will set my target at 19,580. Conversely, if the NQ closes a 1-hour candle above the trend line with a strong bullish candle, I will identify 19,930 as the resistance level.
I've observed several instances of liquidity sweeps with the OANDA:GBPUSD Pound recently. Today, the US Dollar price against the Pound is showing a 0.17% shift. Based on my technical analysis and news flow, I'm confidently targeting 1.2700.
We have seen rejection twice from 2,650 areas. However, if the price is kept above the support price of 2,858, and Gold, the 3rd time, is closed above, if the Gold price increases and a bullish candle again closes above 2,870, my mid-term target will be 2,898
The red box I marked highlights the area of squeezed liquidity. A bearish candle closing below it and the trendline will guide my focus towards the target of the 4hS purple box at 21.586. Let's embrace the challenge and strive for our goals!
If the VANTAGE:NAS100 trend continues to gain momentum, seize the opportunity by executing a SELL using the Z combination strategy. And when a bearish candle closes below 22.020, set your sights on a target of 21.899. Trust your analysis, stay disciplined, and let your determination guide you to success.


